Supply Chain Template

Be ready to move goods to the right location in time to satisfy your customers. Access real-time data about your supply chain.
How to stay competitive in the globalization and expansion of the supply chain industry all around the world? This Supply Chain Template will guide you through the whole process.
Track the flow of inventory through vendors, depots and stores. With all the information in one place, your team will have a single source of truth. More efficient supply chain management can even help you to reduce unnecessary inventory and therefore cut the costs.
In 1997, Supply Chain Management Review published the article 7 Principles of Supply Chain Management that became de facto rule book of the supply chain. We definitely recommend reading it!
Also, you can check on our recent findings about trends in Supply Chain Management.
The template uses a model with SKUs (Stock Keeping Units) that flow between vendors (external suppliers to order SKUs from), depots (distribution points that store larger amounts of SKUs) and stores (where SKUs are actually sold to customers).
The stores order from the depots, and if a depot runs out of stock, the depot orders from a vendor.

Track the orders
Keep all your orders in one place using connected tables.
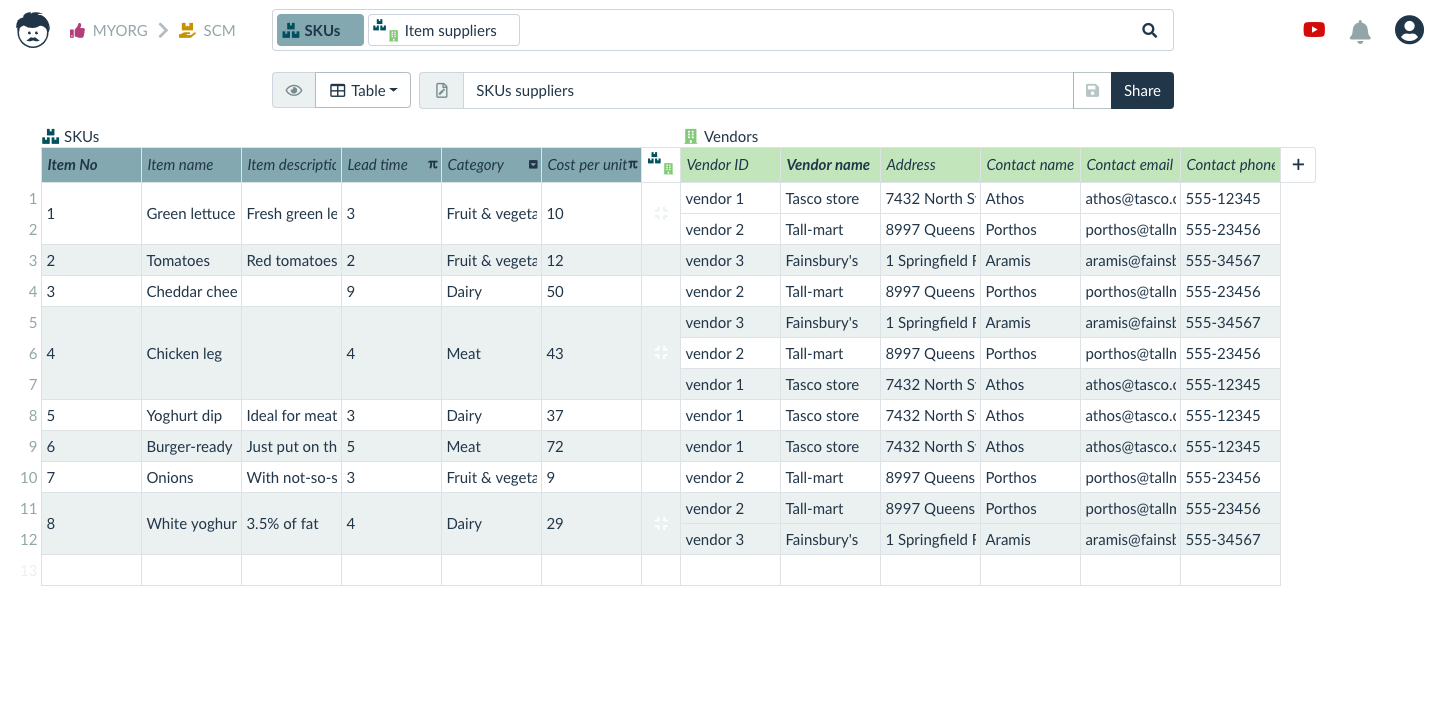
In one place, you can track which SKU is supplied by which Vendor, so when something is low in stock in a depot, you know where should we order from. On the left side, there are SKUs, and on the right side there are linked Vendors which supply that SKU.

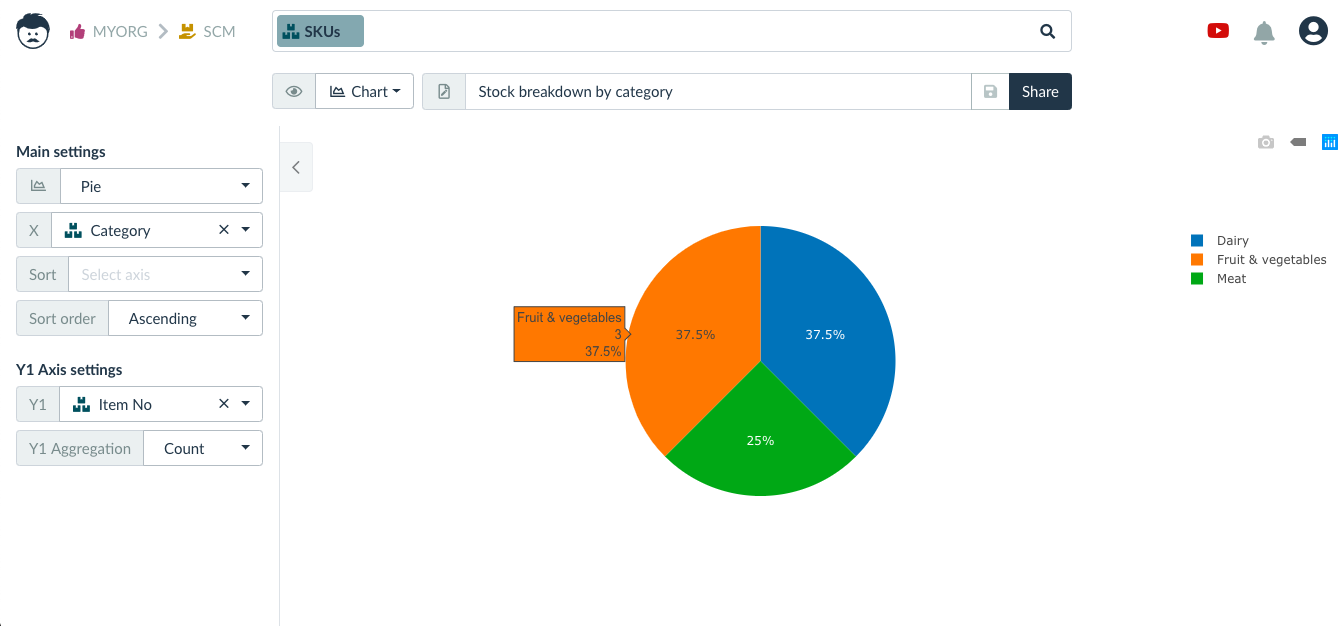
Breakdown of SKUs by categories is easy to understand from a chart.

We can also track orders of SKUs without duplicating any data – SKUs are linked to records with orders. The connection between SKUs and Orders has its own parameters – Number (No) of units and Cost, and what’s more, Cost is automatically calculated from No of units and SKU’s Cost per unit. The Total amount of each order is automatically calculated too.

Compare stock vs. demand
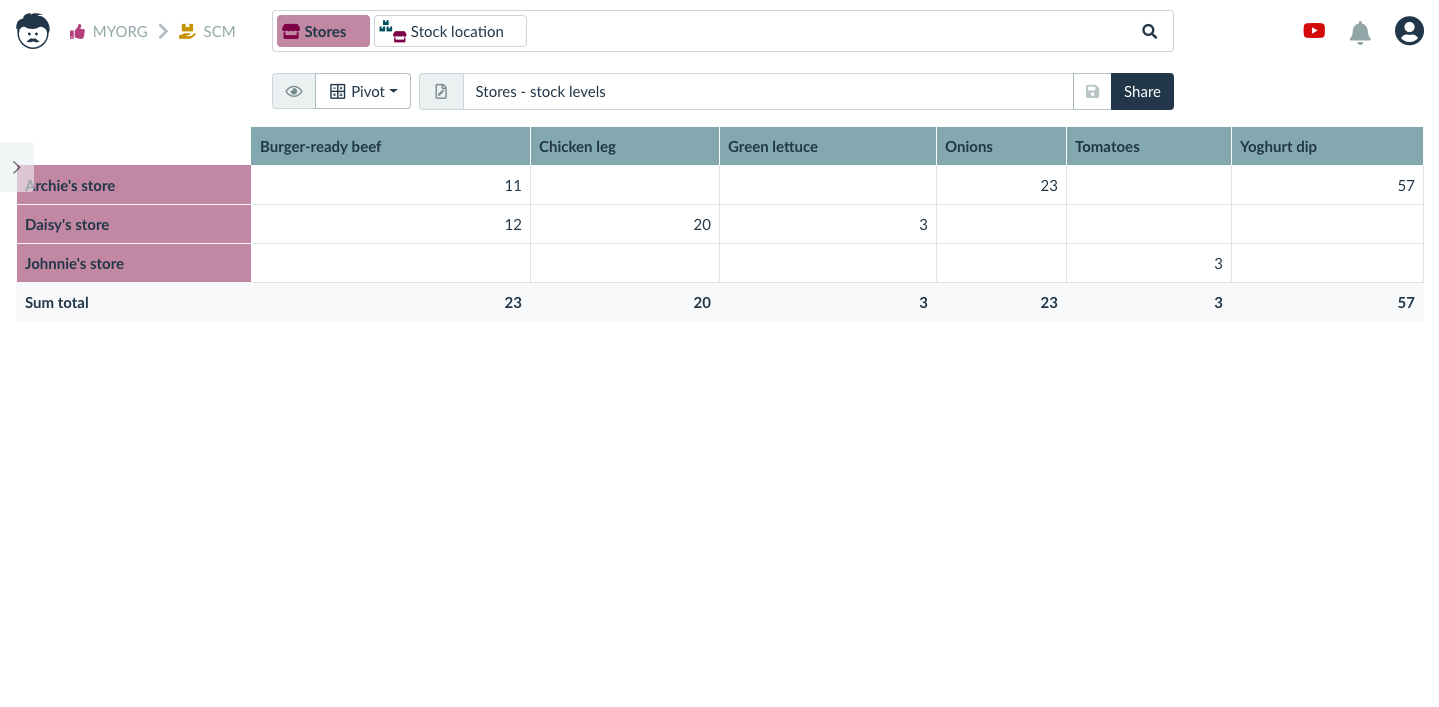
To easily track stock levels in stores, we use a pivot table. Rows represent stores, columns represent SKUs and values in the table represent stock levels (empty means that there is no stock present).

The pivot table also has advanced features for displaying content from multiple tables and links and aggregate it with different functions.
Use them for tracking stock vs. demand on all depots. Demand is calculated from all orders that have not been completed yet. Sum of Stock level represents how many SKU units are in the depot, and Sum of No of units represents how many units are currently requested from the depot in open orders.

Move the inventory just in time when it’s needed. When an order is completed, stock level data are automatically updated.
See everything in a map
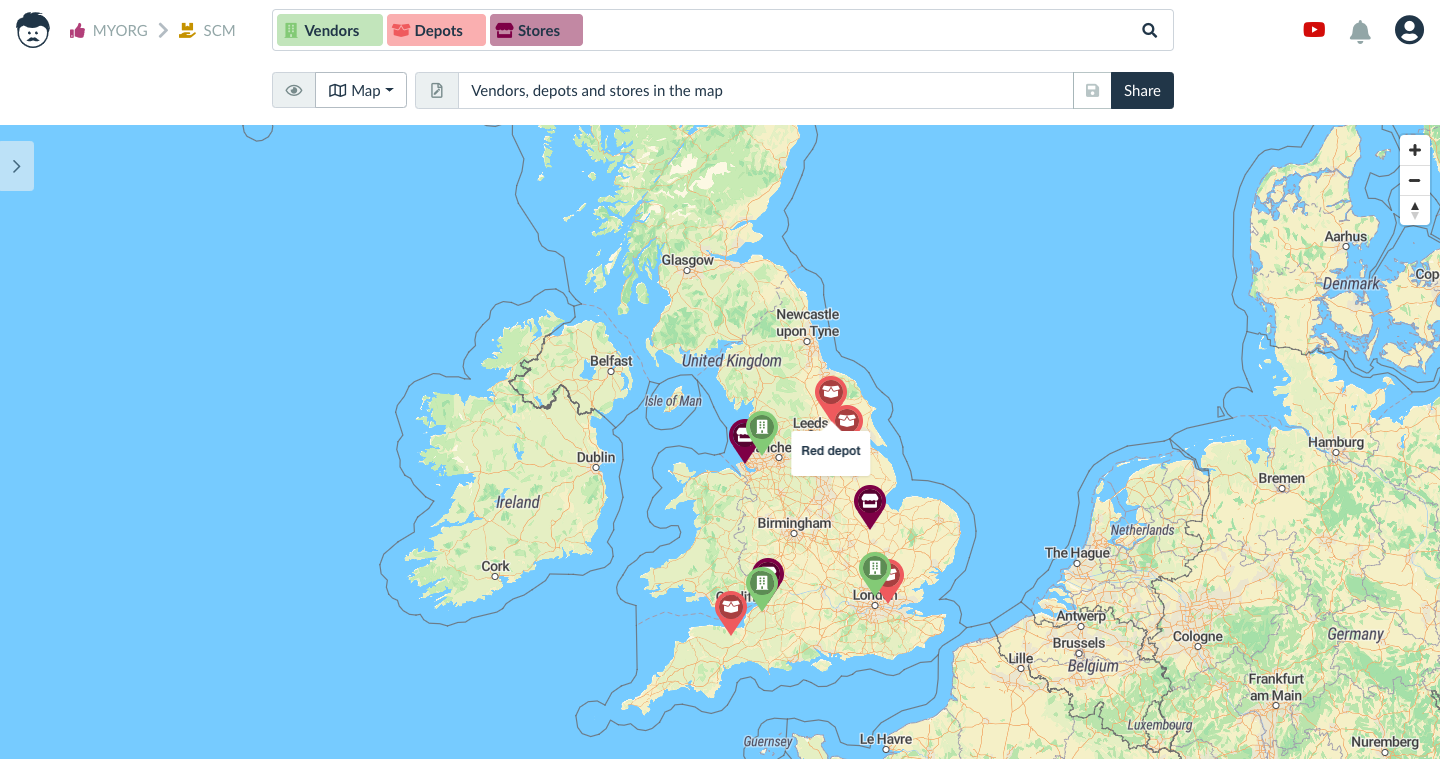
With vendors, depots and stores in one map, you can easily choose the nearest one for the next order. Notice that different colors represent different entities from the search field.

With this template, supply chain management just got easier. Get a copy and turn your supply chain to the best one all around!
Try the Template
Try the template right here1).
1) Some of the functions are available only after a registration.
Supply Chain Template Integrations
Due to Zapier integrations it is possible to connect your supply chain template with the tools you already use for logistics, stock tracking etc.
Upon a stock level change, for example, a new order from a depot can be created automatically.
Best suited for
Company size: small, medium, large
Team size: 1-30
Project complexity: record of SKUs, vendors list, depot locations, store locations, orders, demand and supply tracking
Industry: any with a supply chain
