Risks of Using a Spreadsheet for Project Management

As spreadsheets are easy to start with and learn, there is a huge number of businesses using a spreadsheet for project management, for keeping records and data analysis.
The results are further used for predictions and decision making – definitely very important, sometimes even mission critical tasks.
Spreadsheet Horror Stories
Microsoft claims 1 billion office users. They believe there are above 750 million daily Excel users. Let’s see what can be the impacts of their work.
- By failing to include all the spreadsheet cells in its calculations, the study by Harvard economists Carmen Reinhart and Kenneth Rogoff overstated the impact that debt burdens and turned politicians into a wrong direction.
- Over the past year or so, some 27 human genes have been renamed, all because Microsoft Excel kept misreading their symbols as dates. This is extremely frustrating, even dangerous, corrupting data that scientists have to sort through by hand to restore.
- Thousands of coronavirus cases were not reported for days in the UK because officials exceeded the data limit on their Excel spreadsheet
- An error in a spreadsheet cost TransAlta Corp. $24-million (U.S.), wiping out 10 per cent of the company’s profit in 2003. Someone preparing the electronic file of bids that TransAlta submitted at the end of April 2003 misaligned the rows of information in the spreadsheet.
And there are many more. Fidelity $2.6 billion, Eastman Kodak $15 million, University of Toledo $2.4 million, Emerson $3.7 million, JP Morgan $6.5 billion, Fannie Mae $1.1 billion…
Oracle put together a nice summary in their blog.
But why those errors happen? What can we do to prevent them?
The Path Often Travelled
We all know it. It starts with a simple task – to create a small report. And using a spreadsheet is the fastest and the most convenient way to do it.
However, a report is never small enough. You add some data that weren’t considered before, and another chart, and change some numbers…
Actually, the report has become a living organism. There is always something to improve and you want your report to be as good as it can be.
The data are copied, duplicated, modified and the functions are getting more and more complex.
The report is almost finished, and then it happens… Wait, a few cells are missing from the range, let’s fix that! By the way, what is the exact meaning of this column? Is this per week or overall value? How come that when I change the values, the chart is unaffected?
Suddenly, everything is breaking down and the more you try to save it, the more impossible it seems.
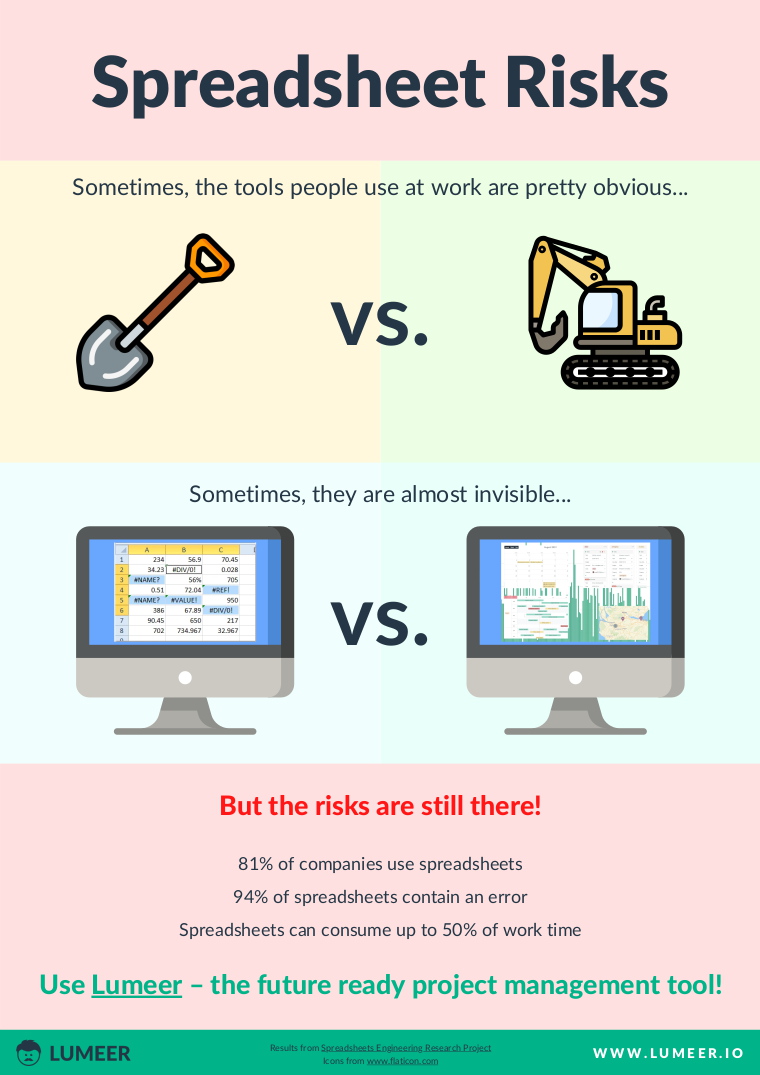
81% of Companies Use Spreadsheets
The rise of spreadsheets in early 80’s meant a revolution in a way how business data is stored, processed, analyzed and presented.
Suddenly, there was no need to use physical sheets. Everything could be stored in a set of tables that were more flexible, more understandable and could effectively perform useful calculations. In those days, it had to look almost like a miracle.
Since then, spreadsheets became the first choice when it comes to working with data in many business. They are easy to start with, offer a lot of flexibility and even unexperienced and non-professional users can use it as a sandbox to experiment with their data.
It is quite usual to have some data in advance and no idea what do we want to search for in these data.
Also, since then, the times they are a changin’. The amount of data entered into spreadsheets grow and they are becoming more and more complex.
Despite the fact that many companies use spreadsheet for project management, the spreadsheet functionalities and possibilities are not growing so fast. The possibilities are now imposing significant limitations on their usage.
But the spreadsheets are so hard-wired into the minds of people that they continue to be used even if they are error-prone and difficult to manage – there is a report that reads: 81% of businesses still use spreadsheets.
94% Probability of an Error
It is an undeniable fact that spreadsheets are one of the most frequently used types of software. Just Excel alone has 750 million users, as Microsoft reports, and there are also other software solutions that share a portion of the market, such as Apple Numbers or Google Sheets.
Those outstanding numbers show that spreadsheets have become a de facto standard for data analysis and manipulation and are widely used by businesses of all sizes from small to big, municipalities and other government organizations.
With that in mind, it is easy to imagine the tremendous impact that can be made by errors in spreadsheets. Unfortunately, those errors exist and are very common.
And this is not just an assumption, there has been an actual scientific research and a number of papers was published on the subject. The errors were categorised in many ways, from hard-coded constraints, wrong formulas, forgotten rows to corrupted links.
Researchers developed an auditing protocol and applied it on 50 real-life spreadsheets from various sources (consulting company, bank, college etc.).
The results are quite disturbing: only 3 of 50 spreadsheets were without error, which means that 94% of spreadsheets contain errors.

It is hard to believe that so many people and organizations rely on such a risky tool. There is even a scientific group maintaining a list of horror stories, real-world cases and examples of how errors in spreadsheet caused several damage, mostly (but not only) financial.
High fines, disrupted investors’ confidence and millions of dollars lost, these are just some of the consequences of forgotten minus signs, too many zeros at the end of the number or manually copied data.
Spreadsheets Can Consume Up to 50% of Work Time
As might be expected, nobody wants to make predictions and decisions based on wrong data. One of the ways to minimize errors is to introduce policies and guidelines on how to create and manage spreadsheets.
Unfortunately, you can’t get that for nothing. And what’s the price? Your own time. Your most precious resource.
According to a study conducted as a part of the Spreadsheet Engineering Research Project, a majority of users spends up to 50% of their time working with spreadsheets.
Unless the person’s job belongs to the field of data analysis, that number is really high. We think that the main cause is a typical spreadsheet lifecycle which has seven interconnected stages, each of them requiring non-trivial effort:

The first step requires you to at least briefly design your spreadsheet even before you actually create it, so you can avoid changing it later. However, we all know that a spreadsheet report is not etched in stone, it rather resembles a living organism.
There will always be something to change or add and the software you use has to encourage it, instead of forcing you to know almost everything in advance.
How to Replace Spreadsheet for Project Management?
We now understand the risks. What is the best way to avoid them and move forward with the same efficiency?
Let’s see what are typical requirements when working with project data (or business data in general):
- We need to easily track tabular data. We need to describe individual entities like clients, orders, invoices, tasks etc.
- To avoid data duplication and confusion between multiple versions, we need to make sure we can link records together. For example, to see what orders were made by which client. Without explicitly specifying all the client details in every single invoice.
- We must empower collaboration of the whole team. Ideally an instant synchronization of team members working anywhere.
- We want to be able to use functions to calculate fields/columns. E.g. to automatically add tax to the order price.
- In addition to the tabular form of our records, we would like to see nice visual representations – charts, timelines (e.g. Gantt chart), boards (e.g. Kanban), calendar etc.
- The data must be searchable. We need to quickly find and display what we search for. We want to be able to describe advanced queries by using relative terms like due date is before next month.
- The access rights must be fine grained and configurable so that we can control who has access to what data.
- Ideally, we want to be able to automate repetitive mundane tasks.
- And finally, integrations with other applications we already use can streamline data bindings.
As we can see, we have already added a few useful requirements on top of traditional spreadsheets. This demonstrates that spreadsheet for project management is not sufficient.
The benefits of the additional requirements are in saved time and higher efficiency of employees. Such requirements are typically met by tools referred to as a Work Operating System.
There are many projects (especially in the Software as a Servise, SaaS area) trying to tap on the market of those who acknowledge the risks of spreadsheets and want to move on. Let’s see one of the major area.
Online Database Applications
Typically, the software meeting all the aforementioned requirements are online database applications, or platforms.
The online databases allow you to develop, and grow, your own application with no (or almost no) coding skills.
An online database typically contains a builder. The builder enables you to quickly and easily create, edit and manage your own database and all of its settings.
After creating an online database, users are able to use ready-made blocks or widgets to build the user interface. The blocks (tables, charts, Kanban boards, Gantt charts, calendars etc.) will draw information from the database. This allows you to create your own custom website application in a very short time.
Typically, online databases offer the same flexibility and are as easy to use as spreadsheet for project management, so the learning curve is very short.
Online Database Solutions
Let’s have a look at a few options to choose from.
Lumeer is one of the most flexible online database solution. The variety of visual perspectives is the best. Lumeer also understands the information you store in the system, so you do not need to specify any functions to work with date and time for example. The advanced aggregation functions across relations between multiple table also cannot be seen in any competition. Plus there is a free forever version.
Airtable is designed for people who want to organize their daily workflows in database form. It is like a mix of database and spreadsheet. It offers some additional visual perspectives like Kanban board (similar to Trello).
Ragic positions itself as a more streamlined and easier-to-use replacement for Excel. As long as you’ve used Excel in the past, you will feel right at home using the app. Designing a database in Ragic is just like developing a spreadsheet in Excel, but the end result is more powerful.
Caspio lets you get create forms and publish databases online, even if you don’t have any coding experience. It’s perfect for both internal documents and customer-facing apps.
Knack lets you interact with your database in a way that Excel does not allow. For example, you can use Knack to make apps such as customer portals, donation managers, event calendars, store locators, etc.
Zoho Creator is another online database that straddles the divide between spreadsheet and app. The many types of collectible information mean you can also create customized front-end apps for all parts of your company.
Fusioo is a database solution that assists teams with collaboration, time sheet tracking and schedule management.
Ganttic is an online resource planning software that visualizes your resources, tasks, and projects through Gantt charts. Ganttic’s easy drag and drop capabilities means you can make schedules in no time and share it with as many people you’d like via a simple URL.
Conclusion
Sure, spreadsheets are accessible and easy to use. Especially for ad hoc analysis. On the other hand, they carry a lot of risks.
These all seem like little things but can ruin complex reports because they are so difficult to find and manage. And in spreadsheets all of this is a hard manual work.
Although spreadsheet software itself offers many powerful functions, it lacks means to verify and control the relationships between the data that are inserted, processed and analyzed.
What is more, those means aren’t just something that can be added or plugged in the future. There aren’t any such means of control because the actual nature of spreadsheets, the way they are and work, doesn’t allow that kind of control.
The only way to maintain data integrity is to use guidelines and methodologies, but another research shows that the majority of users states that common sense is their main testing method.
What we are left with is to take the next step in digitalization and take a look on smart project management tools.