How to Create a Pivot Table In a Few Clicks

A pivot table can reveal some secrets not visible in your data at the first sight. This is why you need to be fast and be able to create a nice pivot table in a few clicks.
We are excited to announce that such pivot tables arrived at Lumeer!
Introduction
“A pivot table is a table of statistics that summarizes the data of a more extensive table. This summary might include sums, averages, or other statistics”, reads Wikipedia.
This is exactly what it does in Lumeer. However, the brilliant thing is that you are able to configure a complex Pivot table on a few clicks of a mouse button. Let’s walk through a practical example.
Let’s start with our Work Tracker project template. There are actually two tables in the project.

Organise Your Data
The tables track Projects a company works on, and company Employees. The employees then log how much time and when they spent on a project. So the two tables are connected and the extra data like amount of time and date are stored on the connection between the two tables.
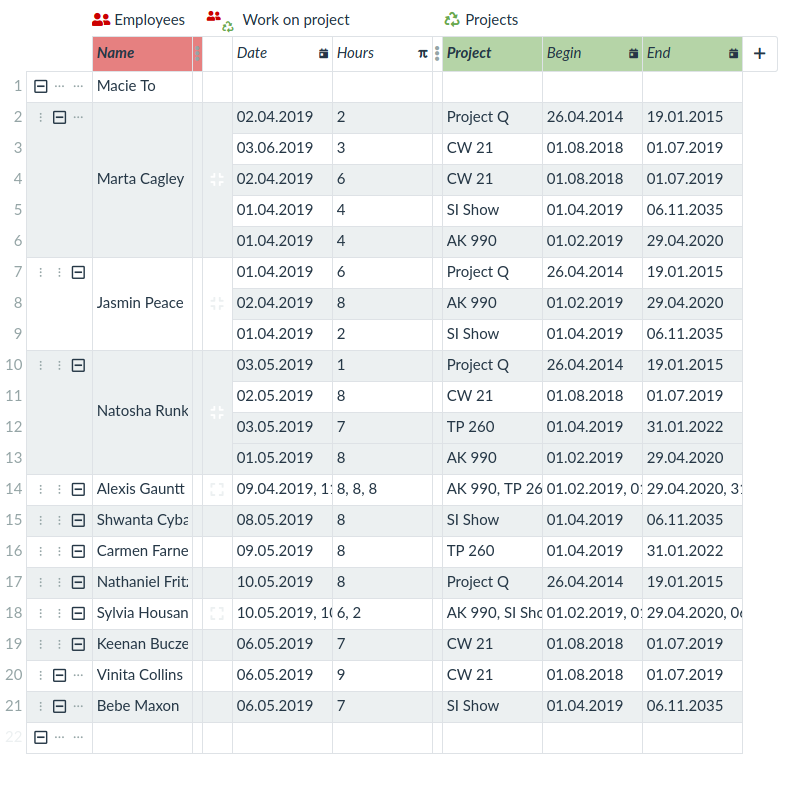
You might be asking a question – why the information about time and date cannot be stored in any of the existing tables? Just imagine that we had the amount of hours stored in the Employees table. Then every employee can have only a single record and can actually work only on a single project once in their lifespan. The similar thing applies to the Projects table. So this is why we need to put the information about time and date in between to be able to connect Projects and Employees many times with different dates and hours reported.
Pivot!
Now we would like to see how many hours employees worked on specific projects. So we switch the perspective to Pivot.
Pivot need a little configuration – those few clicks of a mouse button.
- First, we want to see the employee names in rows.
- The project names are in columns.
- The aggregated values we want to see in the individual cells are hours spent on projects.
This is all it takes to create a nice pivot table.

Advanced Pivoting
Now, we can extend it a bit. For example we would like to see how many hours employees worked on those projects in any given month.
- First, we add the date in the columns.
- Of course we do not want to see every single day, we’d rather want to see them aggregated by months.
- Then, we want to see the months first and then projects, so we change the order by a drag of a mouse.
- Finally, we do not need summary of individual projects anymore, so we switch them off.
The last step will be adding costs per project next to the hours. We track hour rate for every employee, so we can easily use that information.
- We just add the costs attribute and this is it.
Now we can save and share our view.
And if you ever wondered where individual values come from, you can easily click on them and see all the individual records in detail.
We hope that you have enjoyed the simplicity with which you can create a Pivot Table in a few clicks using Lumeer. Now it is your turn to