Pivot Table Examples: An Ultimate Collection of 62 Use Cases for 2022 That Make You Excel in Your Job

We are very proud to present you an ultimate e-book with 62 Pivot Table Examples.
In this e-book, you’ll find one of the most comprehensive databases of Pivot Table use cases that we have collected directly in the field.
These examples can be directly adopted and instantly used in your company. This can make you excel in your job role.

Sign-up to our newsletter for free Pivot Table Examples e-book and Pivot Tables Cheatsheet download
By signing up, you agree to our newsletter terms and conditions.
If you want to refresh your Pivot Table knowledge, have a look at the complete beginners guide we have published recently.

Try the Pivot Tables Here
Try some of the examples directly in Lumeer here.
Book Contents
This is the complete list of examples this book presents:
- Tasks count by their State
- Orders count by Completion State
- Accounts by Industry
- Blank fields
- Count of Opportunities by State
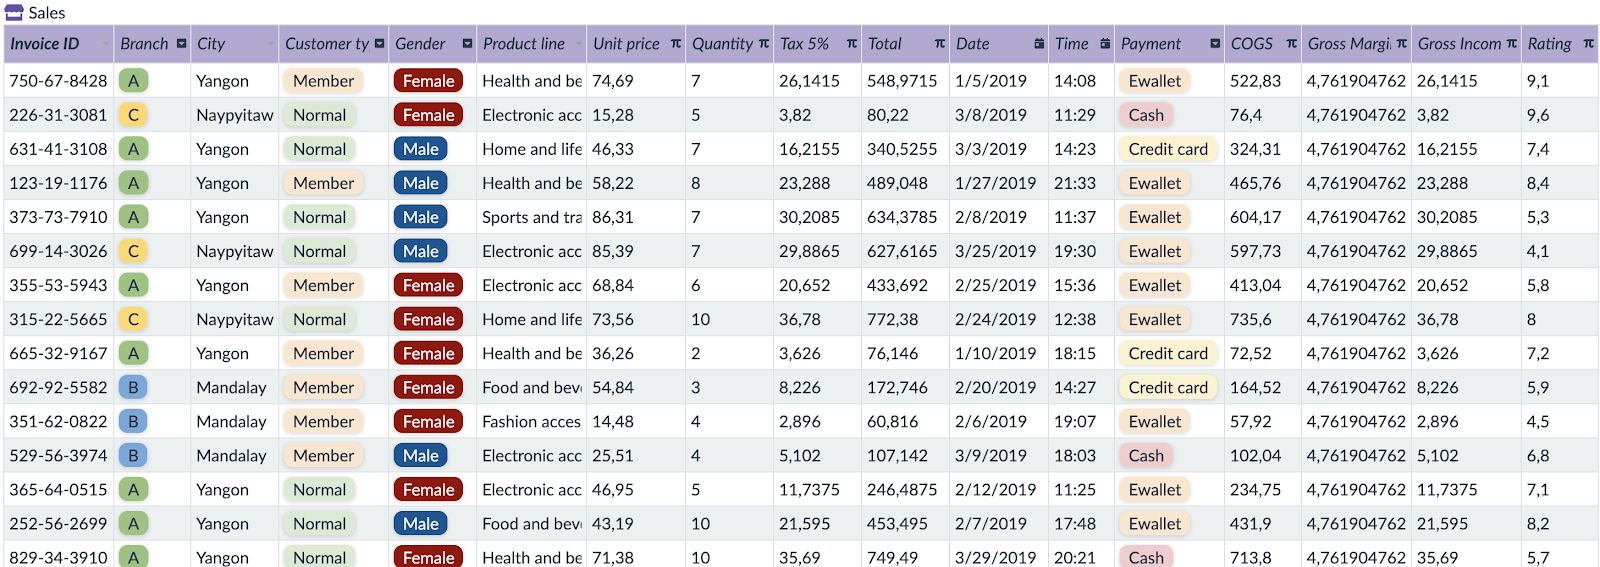
- Count of Sales transactions by the Product line
- List of unique values
- Count of Interviews for individual Clients
- Count of Server Traffic records by Zone
- Sum of Opportunity Values by Stage
- Sum of Time worked on components
- Sum of complete and incomplete Orders
- Count of unique Industries in given Year
- Count of reports per Service
- Sum of Sales by City
- Count of unique Skill sets interviewed for individual Clients
- Sum of overall Bandwidth measured across Zones
- Interviews count by month
- Supermarket Sales amount by the hour of the day
- Average Complaint Response Time
- Sum of Time worked every Month, capped to hours
- Amount of Orders grouped by Months and Years
- Sum of Opportunity Values by quarter
- Sum of overall Bandwidth measured over Months
- Relative Sales by Product line
- Relative count of Accounts in our portfolio by the year of the first contact
- Relative count of Orders by their payment status
- Relative time spent working on each project Component
- Relative number of Complaints by Years
- Relative sum of Opportunity Values by quarter
- Relative count of Interviews per quarters
- Relative overall Bandwidth measured across Zones
- Tasks by Assignee and State
- Accounts by Industry and Lead status
- Sales by Product line and Gender
- Sales by Supermarket and the hour of the day
- Interviews by Client Name and Date
- Value of Orders by Completed? and Paid? state
- Gross Income by Product Line and Branch
- Count of Opportunities by quarter of Date logged and State
- Relative Count of Orders by Completed? and Paid? state
- Relative count of Accounts by Industry and Lead status
- Relative Gross Income by Product Line and Gender
- Relative Gross Income by Gender and Product Line
- Relative Gross Income relative to Product Line and Gender
- Relative Time worked on a project by individual Assignees
- Relative value of Opportunities according to State and Priority
- Relative count of Interviews by quarters and Position Type
- Relative overall Bandwidth measured across Zones and Months
- Relative count of Accounts by Industry and Lead status filtered to most significant Industries
- Relative amount of Sales by Branch, Gender and Product Line
- Tasks by Stage and Due date in quarters, count
- Tasks by Stage and Due date in quarters, Difficulty sum
- Tasks by Stage, State and Due date in quarters, count of Task
- Tasks by Assignee and State, count of Task, sum of Difficulty
- Relative Orders Total amount by Month and Year, and average Order value
- Relative Sales amount by the Day of week and Hour of the day
- Relative count of Opportunities according to State and Priority per quarters
- Relative count of Interviews by quarters, Industry and Position Type
- Relative count of Interviews by Industry, quarter and Position Type
- Relative average Bandwidth and average count Users in Zones across Weeks
- Relative average number of Users in Days of the week and Hours of the day
Why do you need Pivot Tables?
Pivot Tables can quickly reveal many useful information in our records/data that were originally unknown to us or not obvious at first sight.
For example we can quickly spot any invoice after a due date. Or we can see how many tasks are planned for our team.
Pivot Tables are one of the basic business analytical tools. Their usage is essential to anyone who wants to base their decisions on hard facts. So that your decisions are the best you can make.
Pivot Table Examples
We will be using the standard terms for the Pivot Table settings like Row Label, Column Label, Summation Value that we listed in our Pivot Table Guide.
Every single Pivot Table Example describes the purpose (usage), the individual settings (Row Label, Column Label, Summation Value), possible alternatives and references to other examples that are based on them.
Sign-up to our newsletter for free Pivot Table Examples e-book and Pivot Tables Cheatsheet download
By signing up, you agree to our newsletter terms and conditions.
