6 Reasons That Make Gantt Chart an Invaluable Tool

Gantt chart (or timeline) is a term widely known among those who came into contact with project management.
They are useful for planning new projects and having a clear overview of them. That makes them a very popular tool among successful project managers.
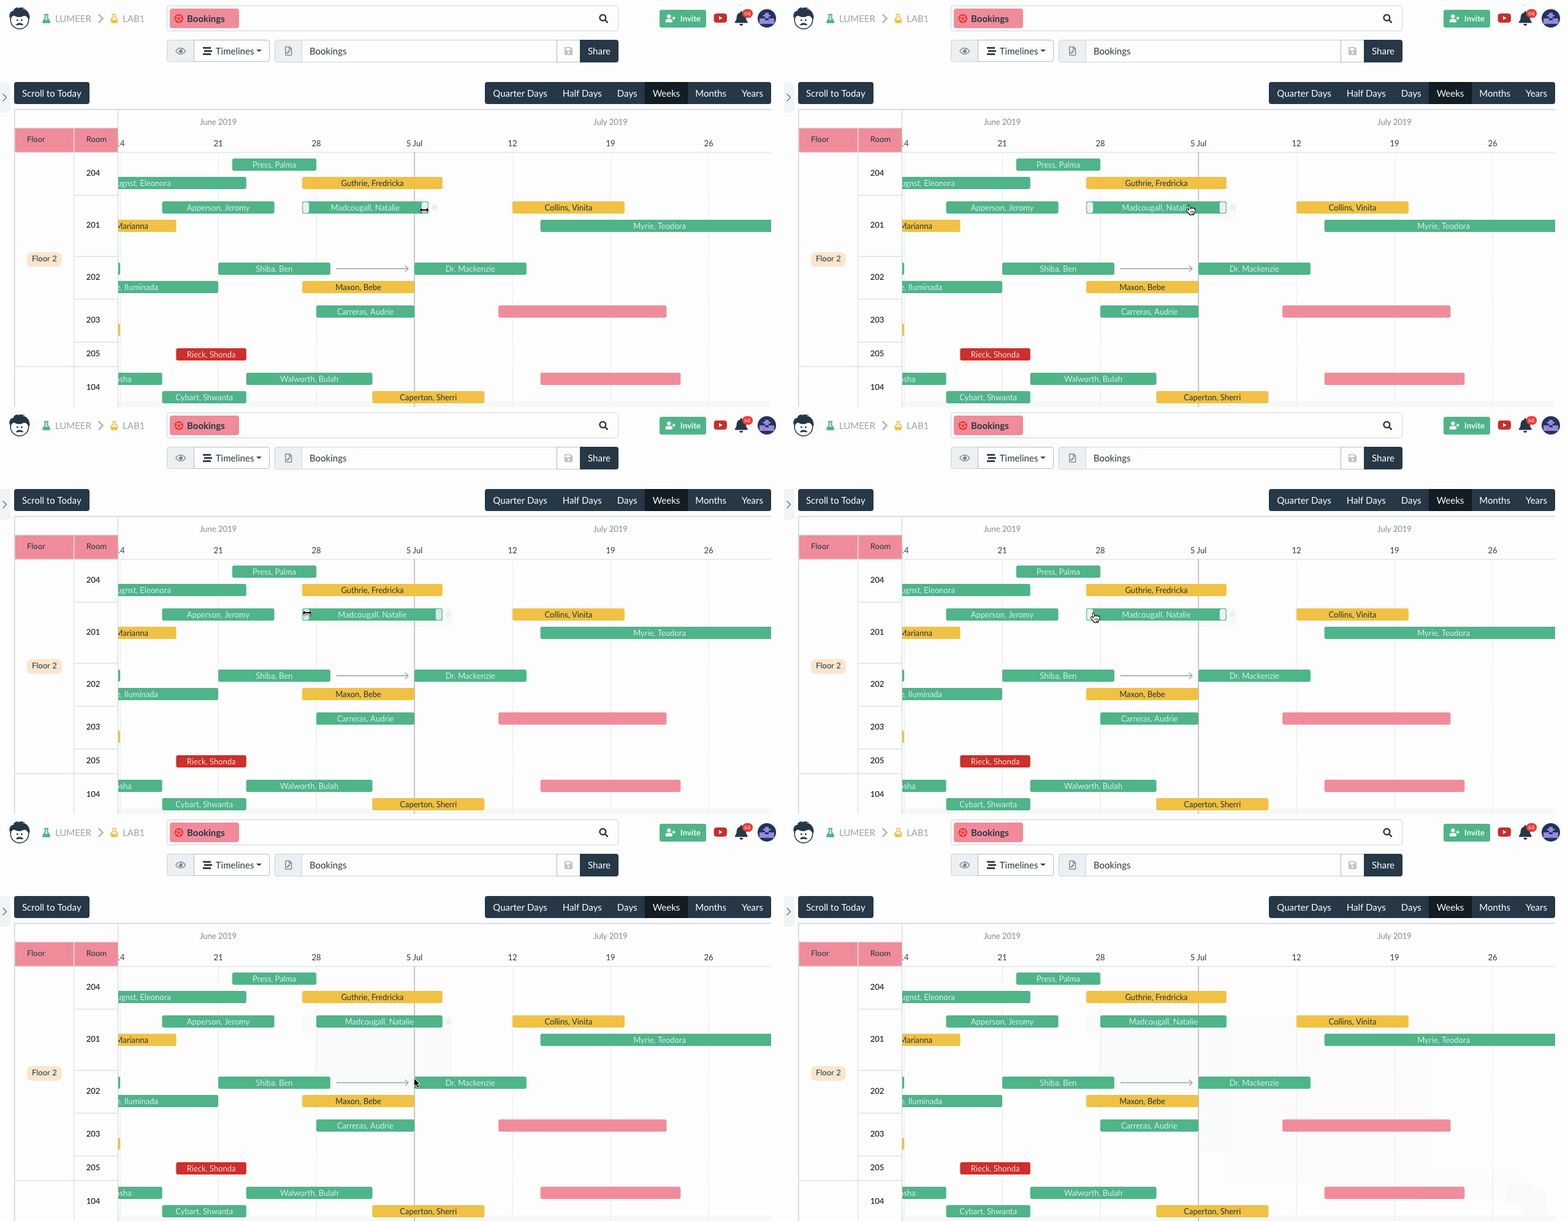
What is a Gantt chart? It’s a set of horizontal columns that you can use to record and visualize the timeline of your project, program or ongoing work.
You can see your schedule and important deadlines, and the lenght of the column represents time required to complete the task.
Besides that, it shows you who currently works on what and how much time did they already spend on it.
What makes Gantt charts so popular?

1) Detailed Planning and Scheduling
The ability to create project plans and their visual schedules is the most important timeline feature. You can record and watch every detail of the project, such as tasks with their duration, people who work on the project, key deadlines – all of that real-time.
Gantt charts provide a clear overview of project’s progress so that it is easy to understand. You can share the project timeline with your clients, plan who’s going to work on it and stay on top of your tasks and deadlines.
Don’t forget: working according to the plan is a key.
2) Who, Where, When? With the Gantt Chart, You Always Know
Imagine the timeline as mechanical weights: on the one side, there are tasks which need to be done, and on the other side, there is everything else connected to it, such as time data or employees.
This kind of visual perspective gives project managers and teams a better overview of every task and activity in multiple projects.
With the timeline, everybody knows the important details – what needs to be done, how long does it take or what can’t be completed on time.
Gantt chart will help you to assign people to tasks more effectively – you will have a good overview of who works on what.
3) Everybody Has the Same Goal
Better cooperation and communication are another benefits of timelines that you can make use of in project management.
Behind every successful project, there is a team and all its members. Therefore, they all need to have access to all information that is required for their work.
Gantt chart takes care of that – it ensures that there is undisturbed communication among the teams, without misunderstandings, and keeps the effectiveness levels high.
4) Transparency
Apart from displaying details of the tasks, the timelines are a great tool for defining task relationships as well.
Gantt chart gives project managers a clear view of task dependencies, making it easier to allocate resources.
It is easier to visualize the big picture when you see the dependencies between the tasks, e.g. how the end of one affects the start of another.
This is an ideal tool if you want to identify problems and resolve possible conflicts even before the project starts.
5) Alignment
Chaos creates even more chaos. Gantt chart is a simple way to organize your projects, plans and tasks.
Do you sometimes find yourself losing an important piece of information? With Gantt chart, that won’t happen.
On the contrary, you can be sure that everything is progressing in an organized manner. It saves time so that you or your colleagues won’t burn out.
6) Watching Progress in Real-time
After putting the relevant data into the diagram and sharing it with your collaborators, you can monitor the current status of the project.
If you want to see the progress and direction of the project at any time, you have just found a perfect tool to do it.
Who Are the Timelines For?
Gantt charts are great for those teams who need to see their projects in a timeline.
Events, tasks or other items should therefore have a start and an end to be displayed properly.
Whether you plan a marketing campaign, new product launch, building electrical conduit or a press conference, Gantt charts are a great (although not the only) solution.
Some projects are better visualized in Kanban boards or calendars.
Because of that, your project management tool should be able to display your projects in multiple views. You can then choose the right perspective depending on what kind of project you are currently working on.
What to Do With the Gantt Chart?
You can have either a general or a concrete timeline. It depends on whether you work with a team that needs to plan forward.
What should a Gantt chart actually contain?
- Project deadline
- Starts and ends of the tasks
- Duration of every task
- Who is responsible for the task
- Which tasks depend on other people
- How the task is divided
You can then use them for varios projects with a couple of examples below.
Launching a New Product
Gantt chart will help you map the whole plan: from the initial idea, through the launch itself and to the subsequent sales.
Thanks to the visualization of the steps on the timeline, you can see (even before the start) whether there are any conflixts or colisions, set the dependencies and decide if and when you should do the launch.
Planning an Election Campaign
Bigger campaigns require you to keep cool, cooperate and coordinate.
There are many small steps and it can be easy to forget about one or two. Gantt charts make this process much easier. They visualize one step after the another, with information about who is responsible and how long does it take.
The teams then know who works on what and how their work affects others.
Delivering a Product to the Client
Agencies often use Gantt charts to show the client when they deliver the product and how much time will it take.
Thanks to such plans, the client has important information: what they pay for, when it gets delivered and how long does it take.

Disadvantages of Gantt Charts
Gantt charts are not error-free. It takes a significant amount of time to create them.
That applies especially if you use spreadsheets. Prepare to be patient. If you use spreadsheet templates, prepare to be twice as patient. It might take some time to adjust it to your team’s needs. However, you can easily get rid of this problem with Gannt chart in Lumeer.
It’s also difficult to keep the project aligned with the plan. Traditional timelines are most useful in the planning phase. After that, the managers often reach for other tools or platforms to manage day-to-day work.
What’s more, the timeline can easily get too overwhelming. Micro-steps for every milestone, files and notes for your colleagues – if there is too many of them, a simple visual can turn into a chaos.
Fortunately, there are other alternatives to give you bird’s-eye view over your projects.
Where to Put the Gantt Chart?
Depending on your current work (or after you did your high-level planning with a Gantt chart), Kanban or calendar might be more suitable to set and visualize your projects in time.
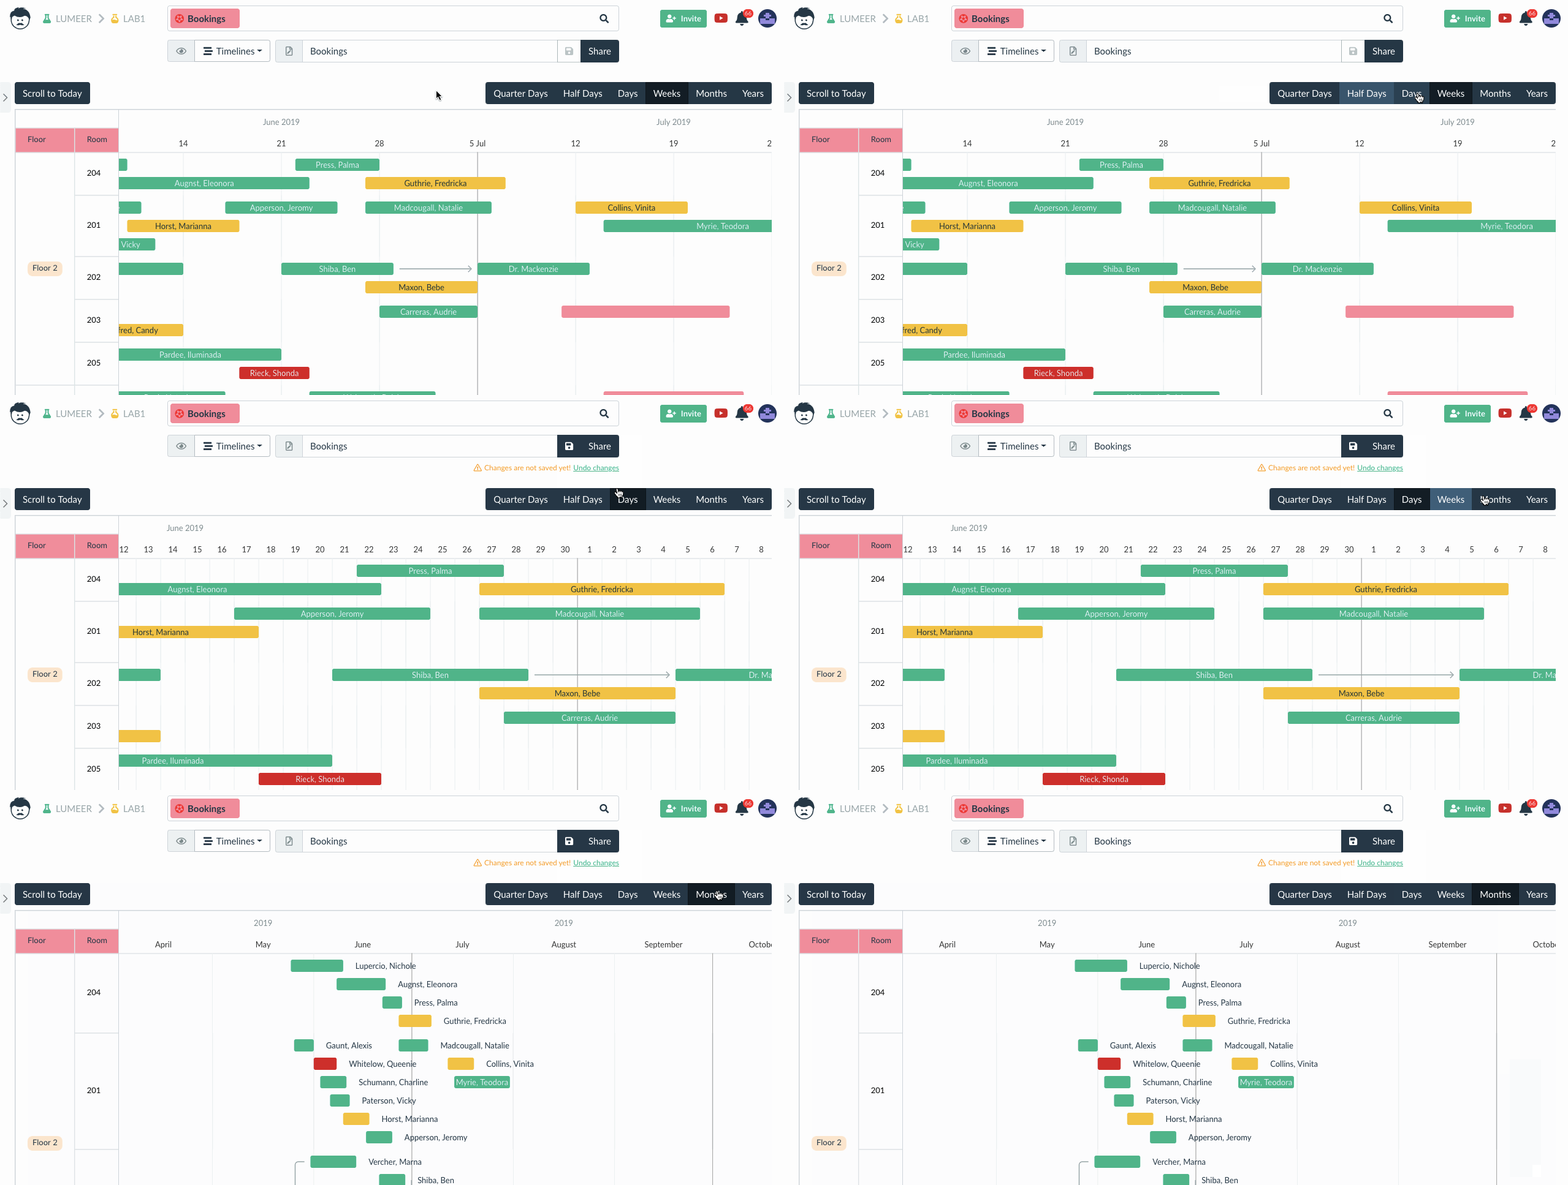
With Lumeer, you can switch between the views. You can choose whether you want to view your project as a timeline, list, table, board or calendar. The rest of the team can do the same – they can use the view that suits them best.
No matter which view is the best: When choosing your tools, don’t forget to consider the basic criteria for a great user experience:
- Choose a simple, intuitive and responsive solution with a nice user interface.
- Make sure that the software tool provides features that match your needs.
- Check whether it can be integrated with other third-party applications you use.
- Ensure that the software provides sufficient data security.
- Give extra points to the tools that you can try for free.
And don’t forget to look at customer reviews, they can say more than a hundred articles.

