Custom Dashboards
Use custom dashboards to get an immediate overview of your project after login. You can see your key performance indicators at a glance.
Accessing the Custom Dashboards Settings
The Search view works as a default home screen that can be fully configured.
You can access the dashboards setting using the cog icon in the top right part of the Search view.
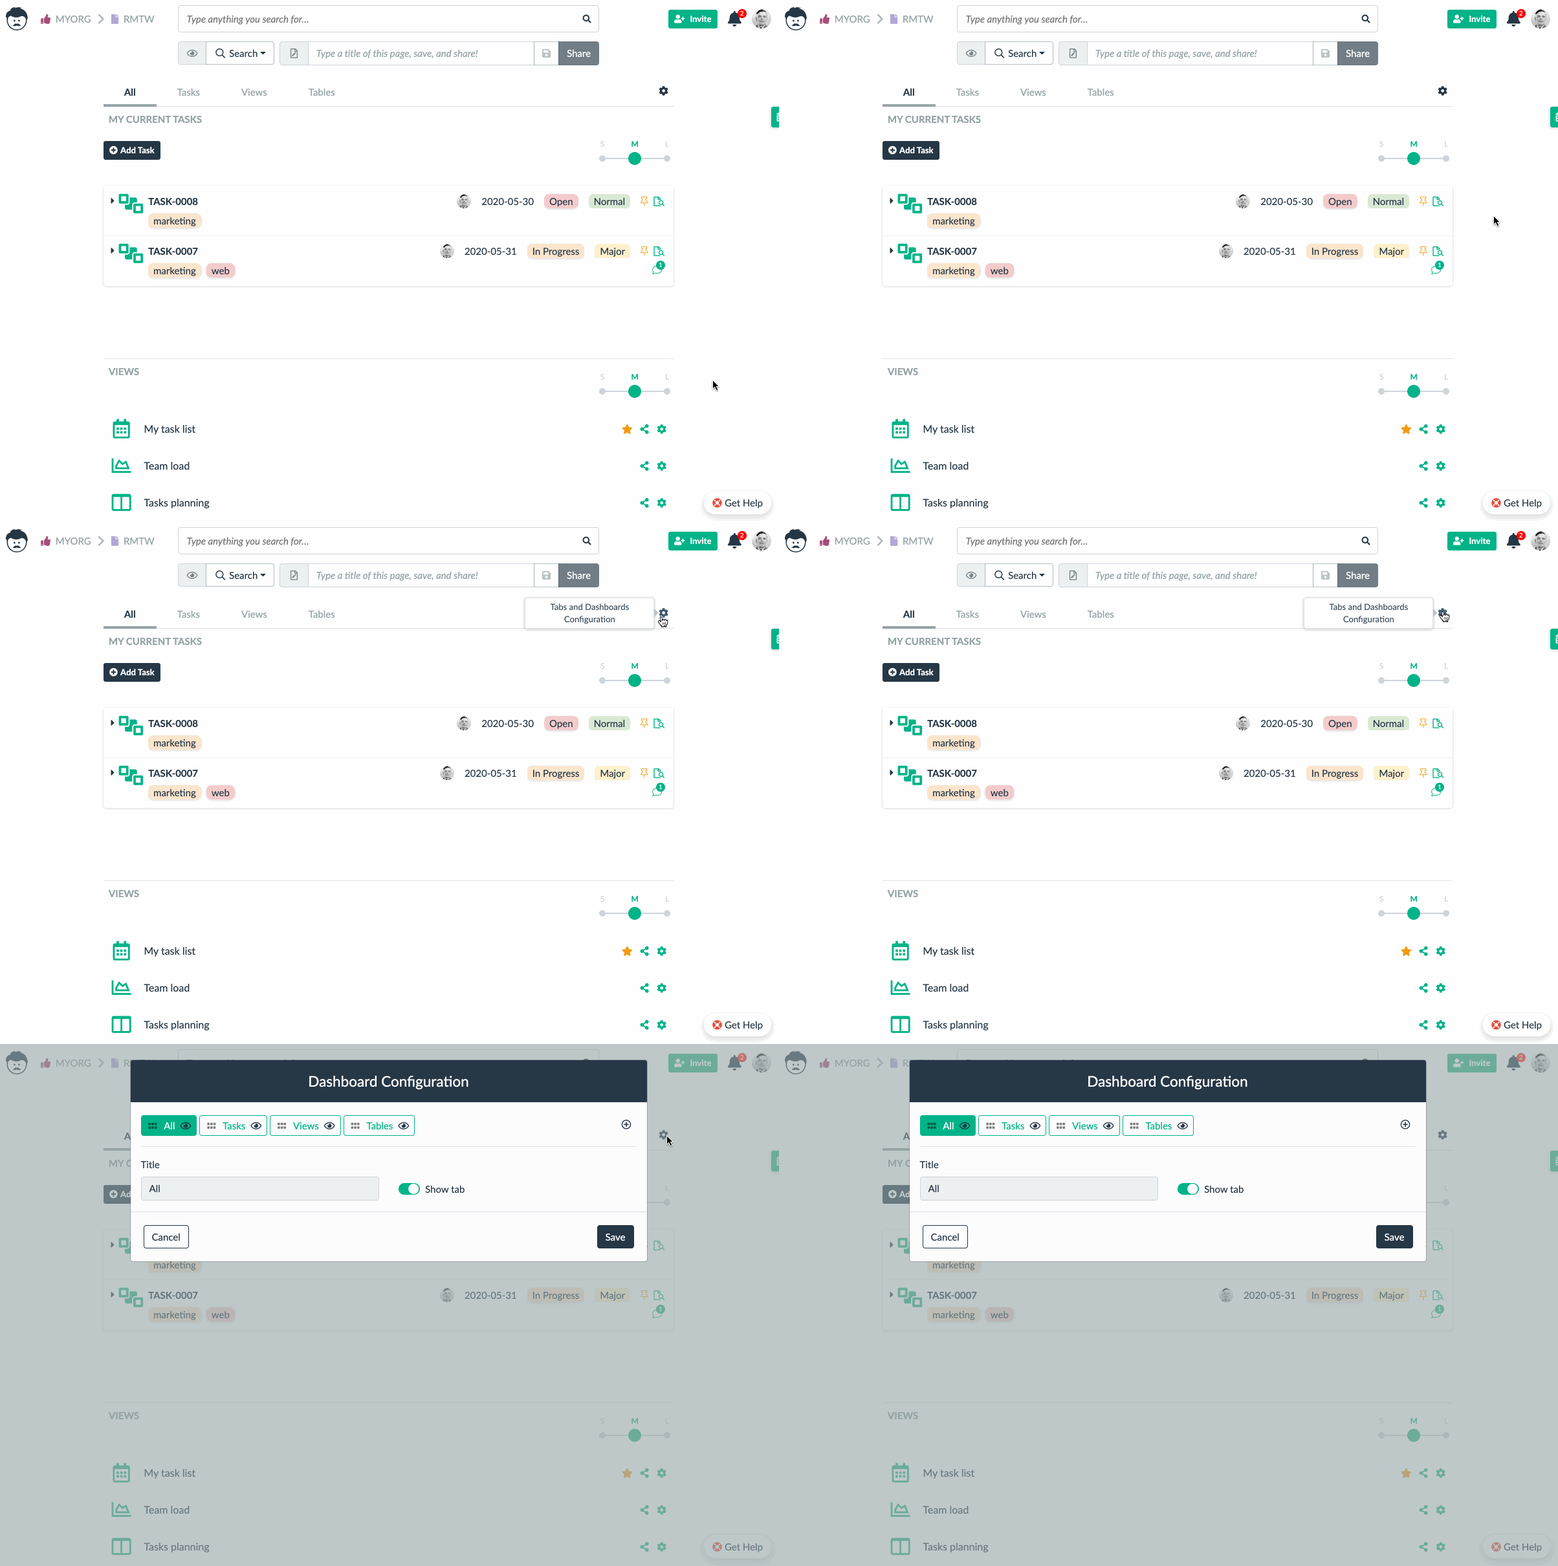
Please note that we do not have any active view (there is no view name in the top panel). This is important and we’ll get back to that later.
Setting Visible Tabs
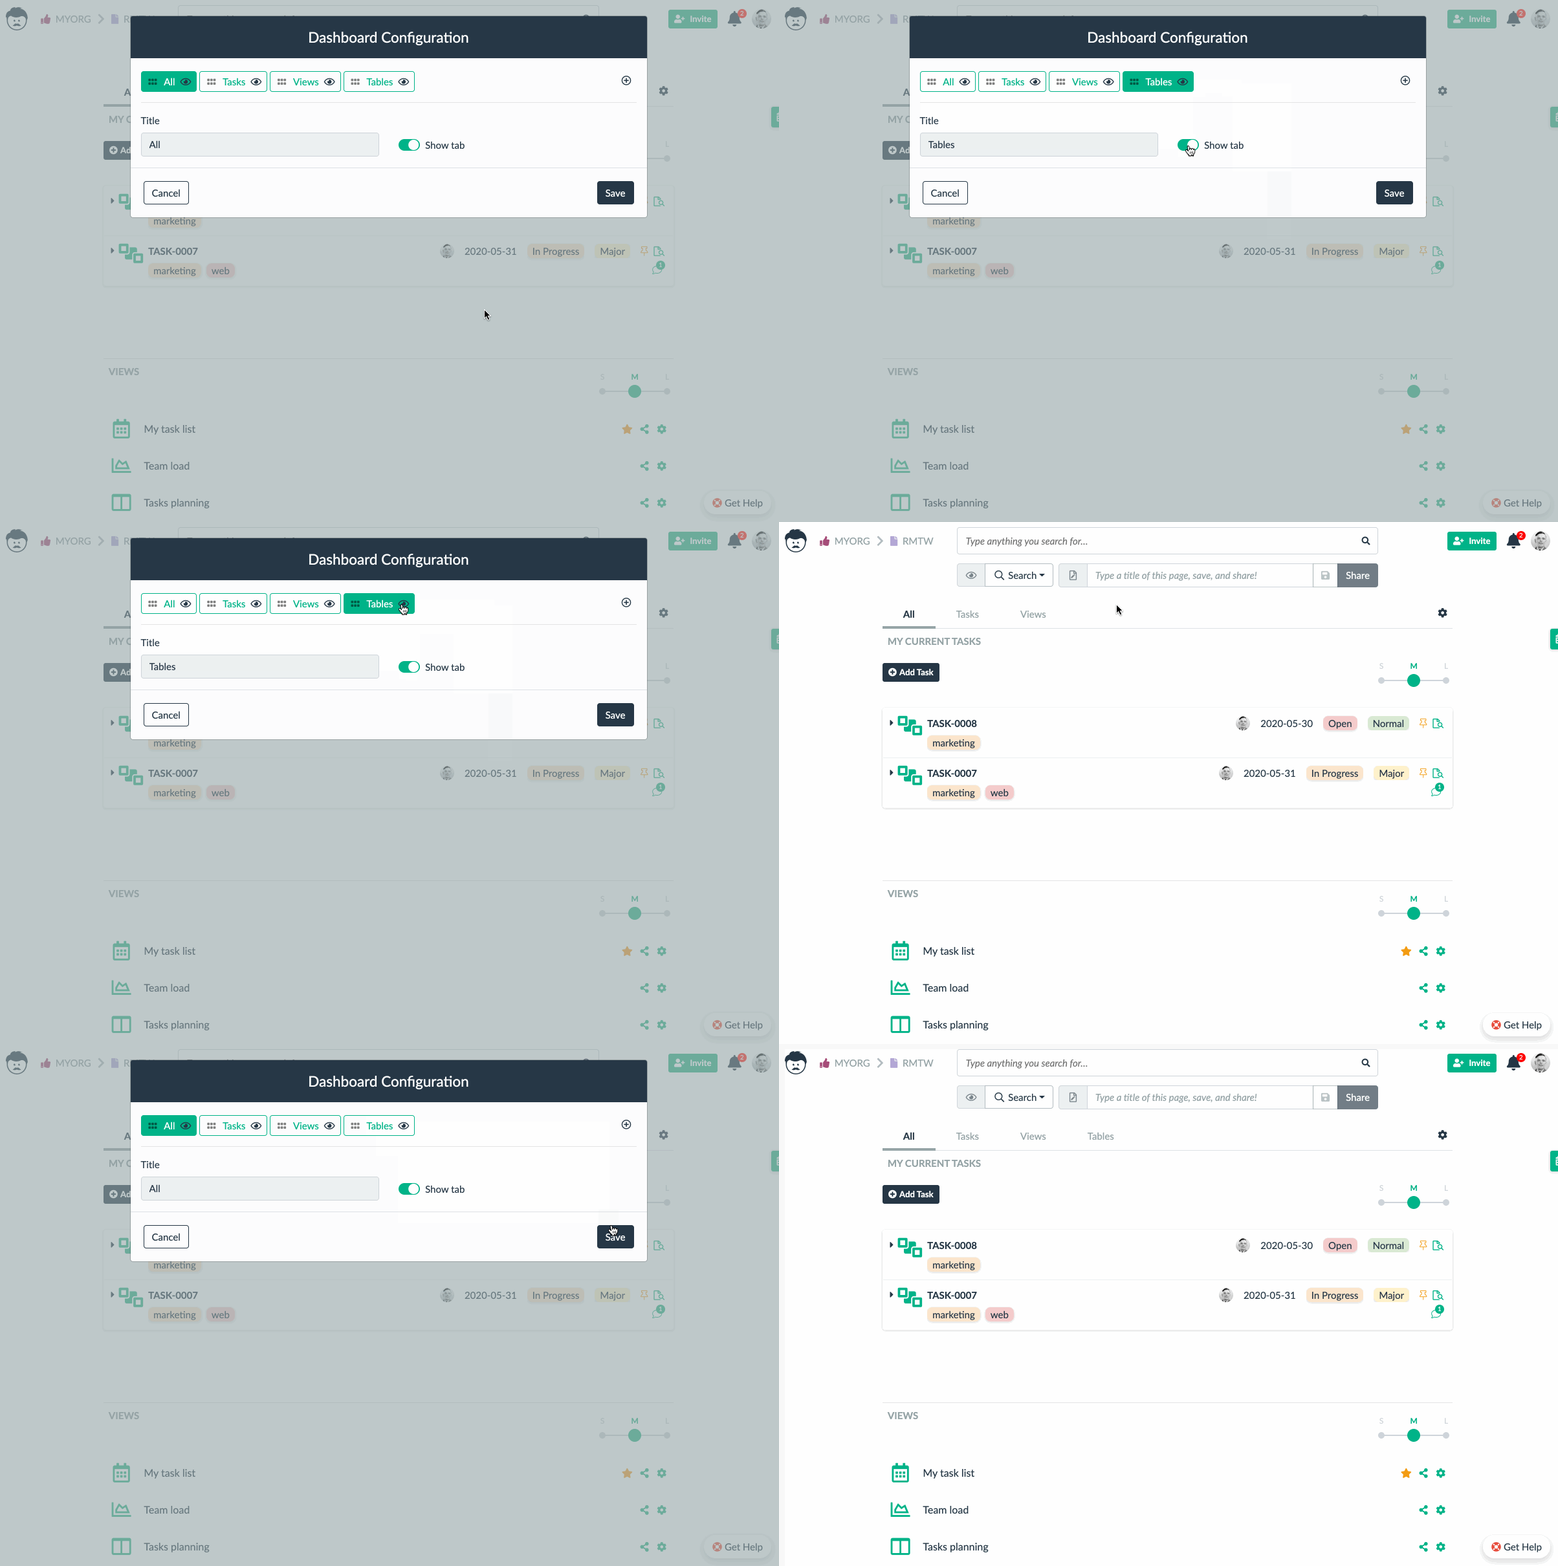
The first thing you can do is setting the visible tabs. Sometimes, you might prefer to hide Tasks when not using them. Some users also prefer hiding Tables so that they do not change raw data by mistake.
Rearranging Tabs
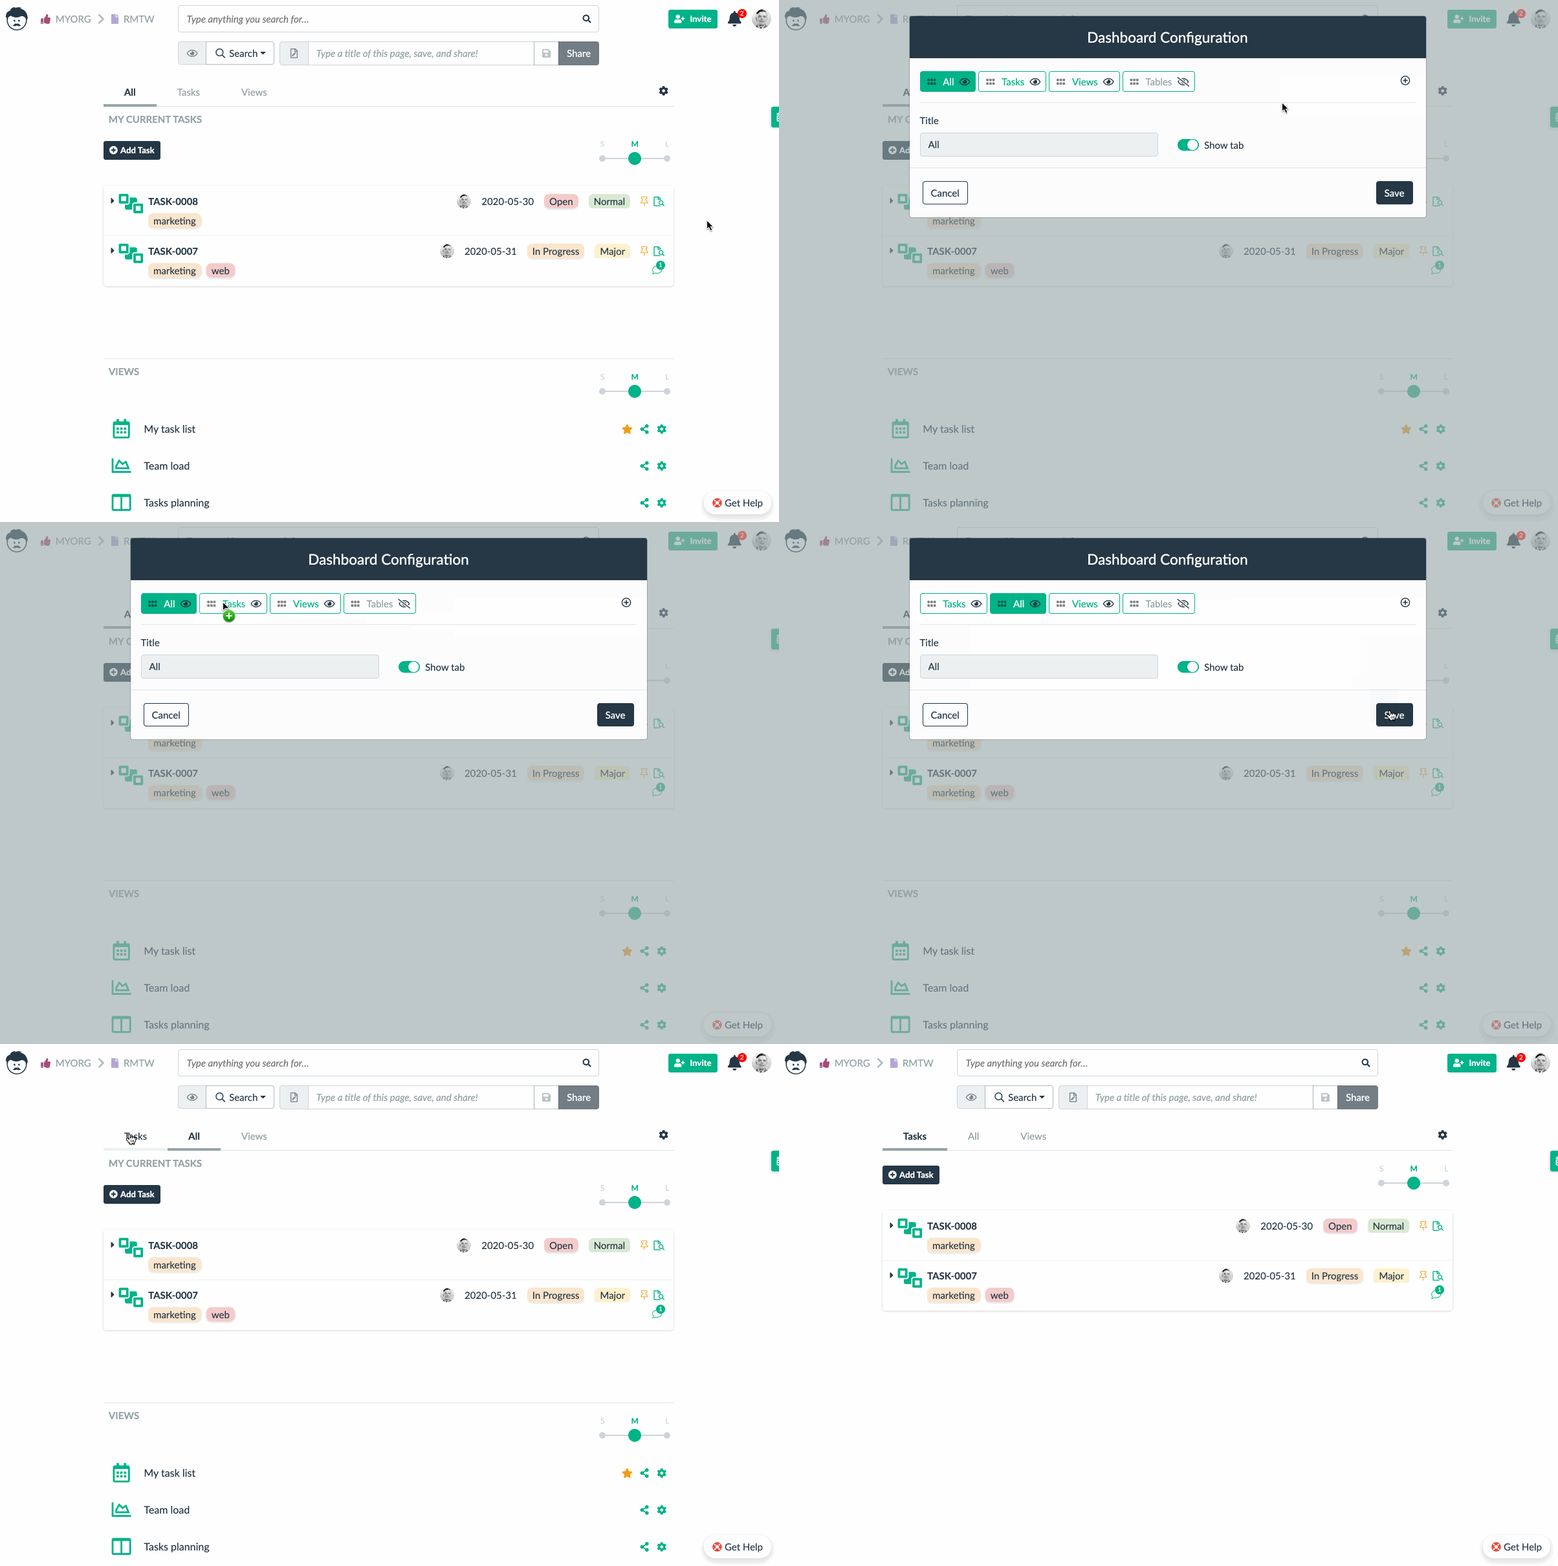
You can also move the tabs by dragging them.
Adding a Custom Tab
The main benefit of using custom dashboards are custom tabs. You can easily add them by clicking on the plus icon. You can also specify any tab name you want.
Adding Rows to the Custom Tab
Once you have a custom tab created, you can add any number of rows. Rows can be divided into multiple sections with standard divisions (e.g. whole row, 1:1, 1:2…).
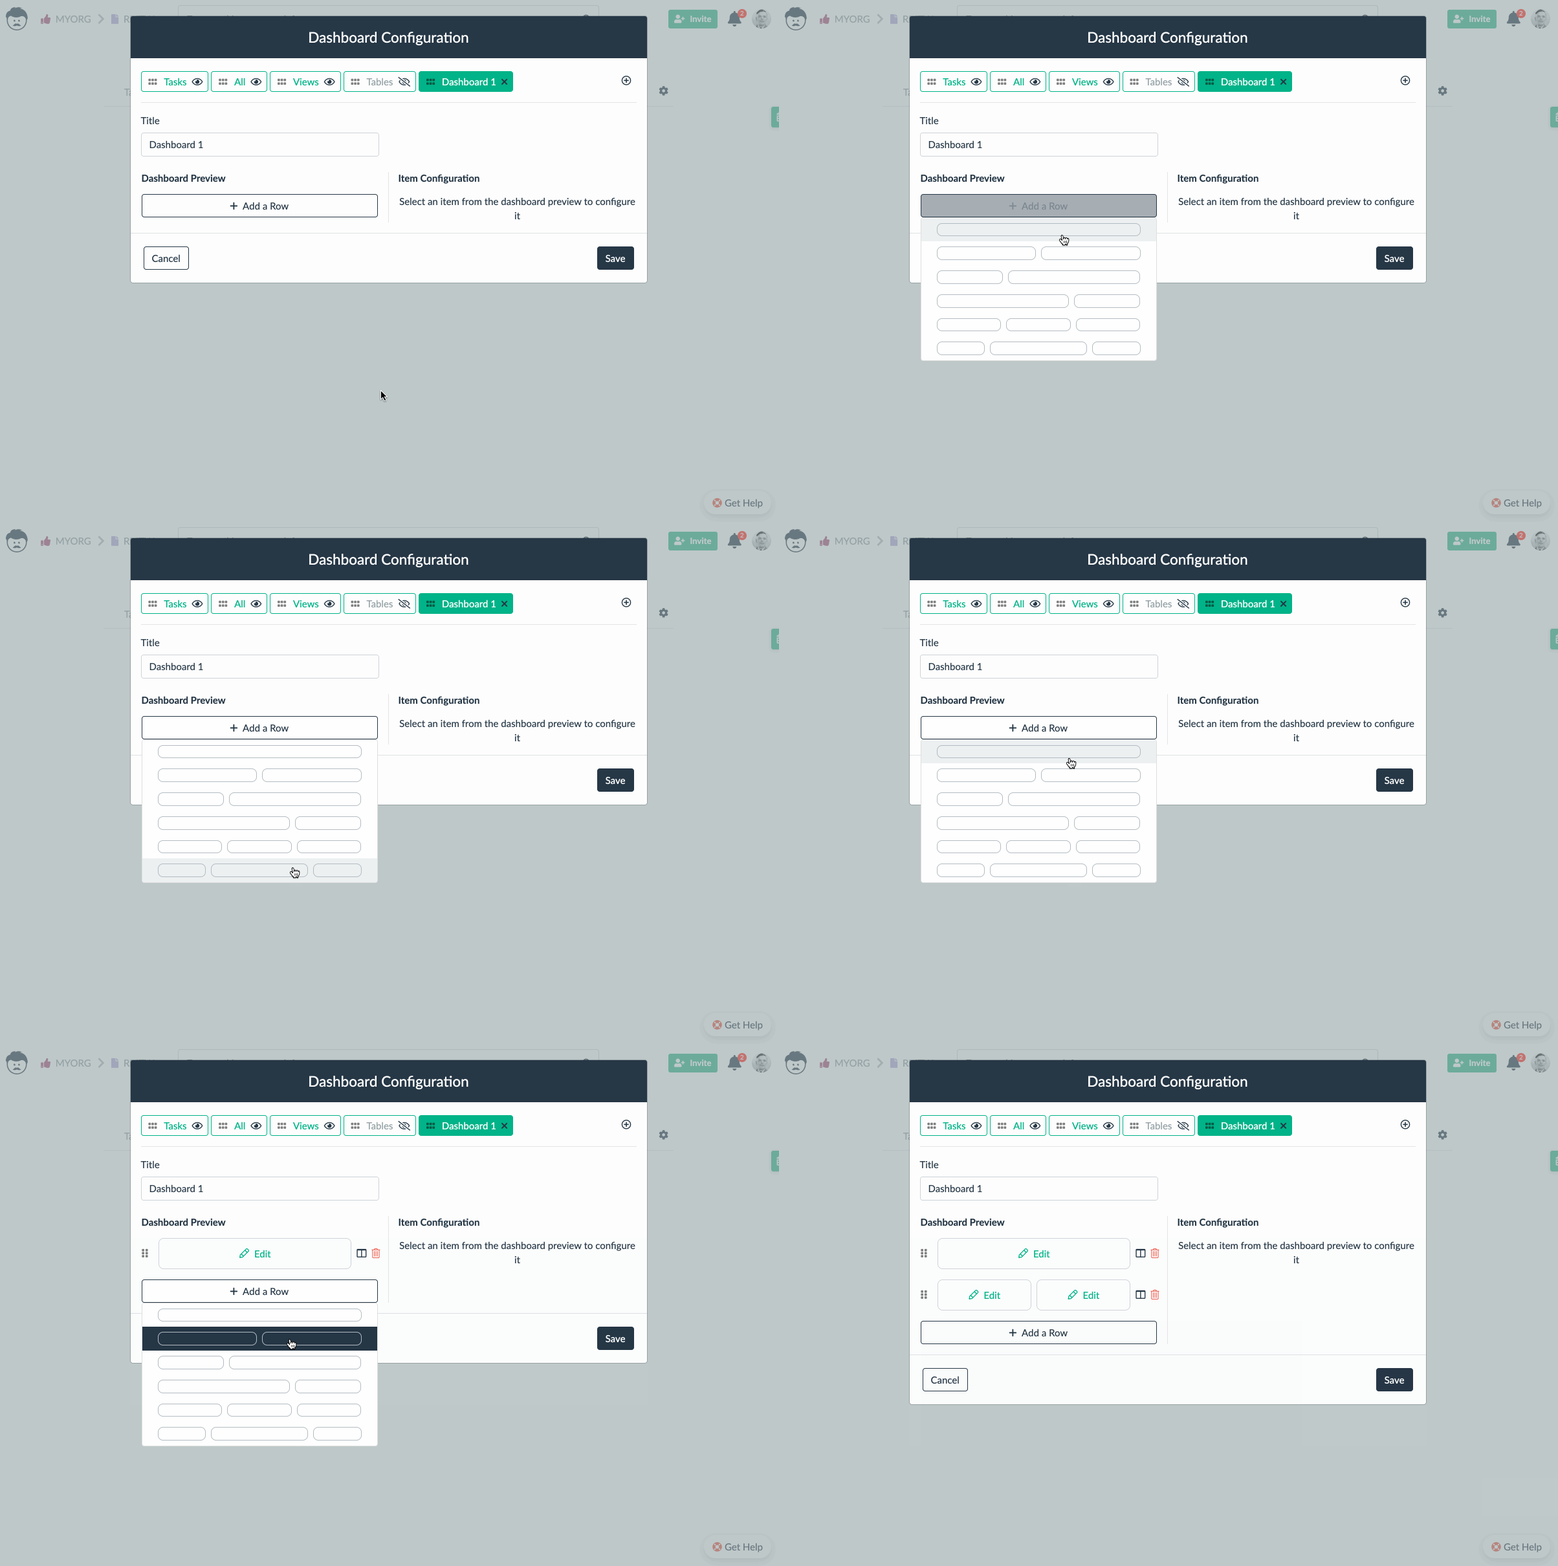
Rows can be rearranged by a drag of a mouse, or you can also change their sections afterwards.

Setting Row Sections
By clicking on an individual section in a row, you open its configuration on the right side.
There are three types of the sections:
- a view – an existing view is displayed in the section
- an image – a custom image is displayed in the section (e.g. a roadmap, or a dynamically generated image from another tool)
- notes – a rich text input is displayed in the section that allows you to take arbitrary notes
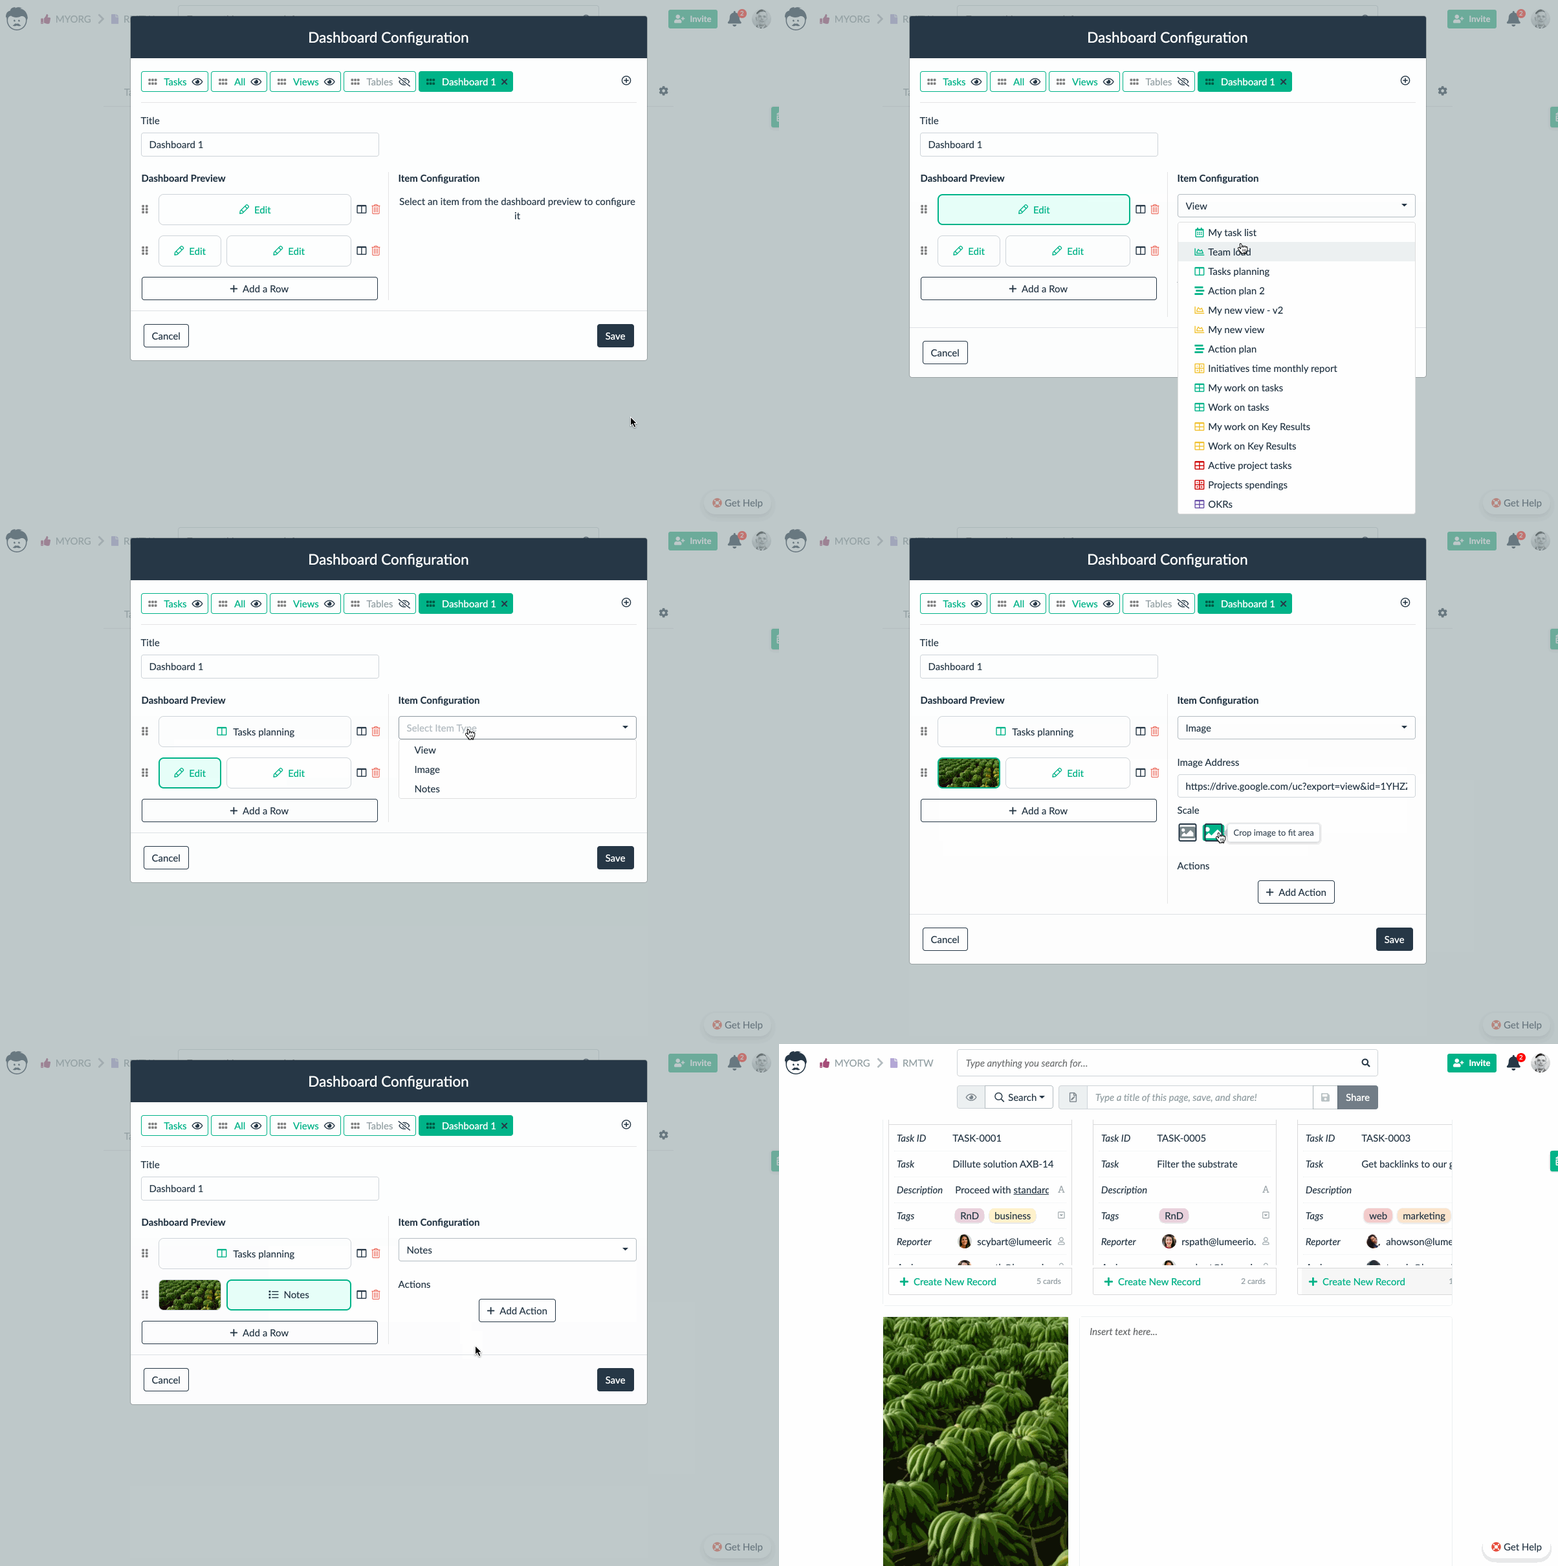
Views on a custom dashboard work exactly the same as when opened normally. You can directly add, update, and delete records like you are already used to.
Action Buttons
For each section, you can configure action buttons. These buttons can take you to any existing view. When you set the section type to a view and set a view, a default action button is already added. This default button opens the view that is set in the section. It is of course possible to delete this button or add more.
Each action button has a configurable color and icon.
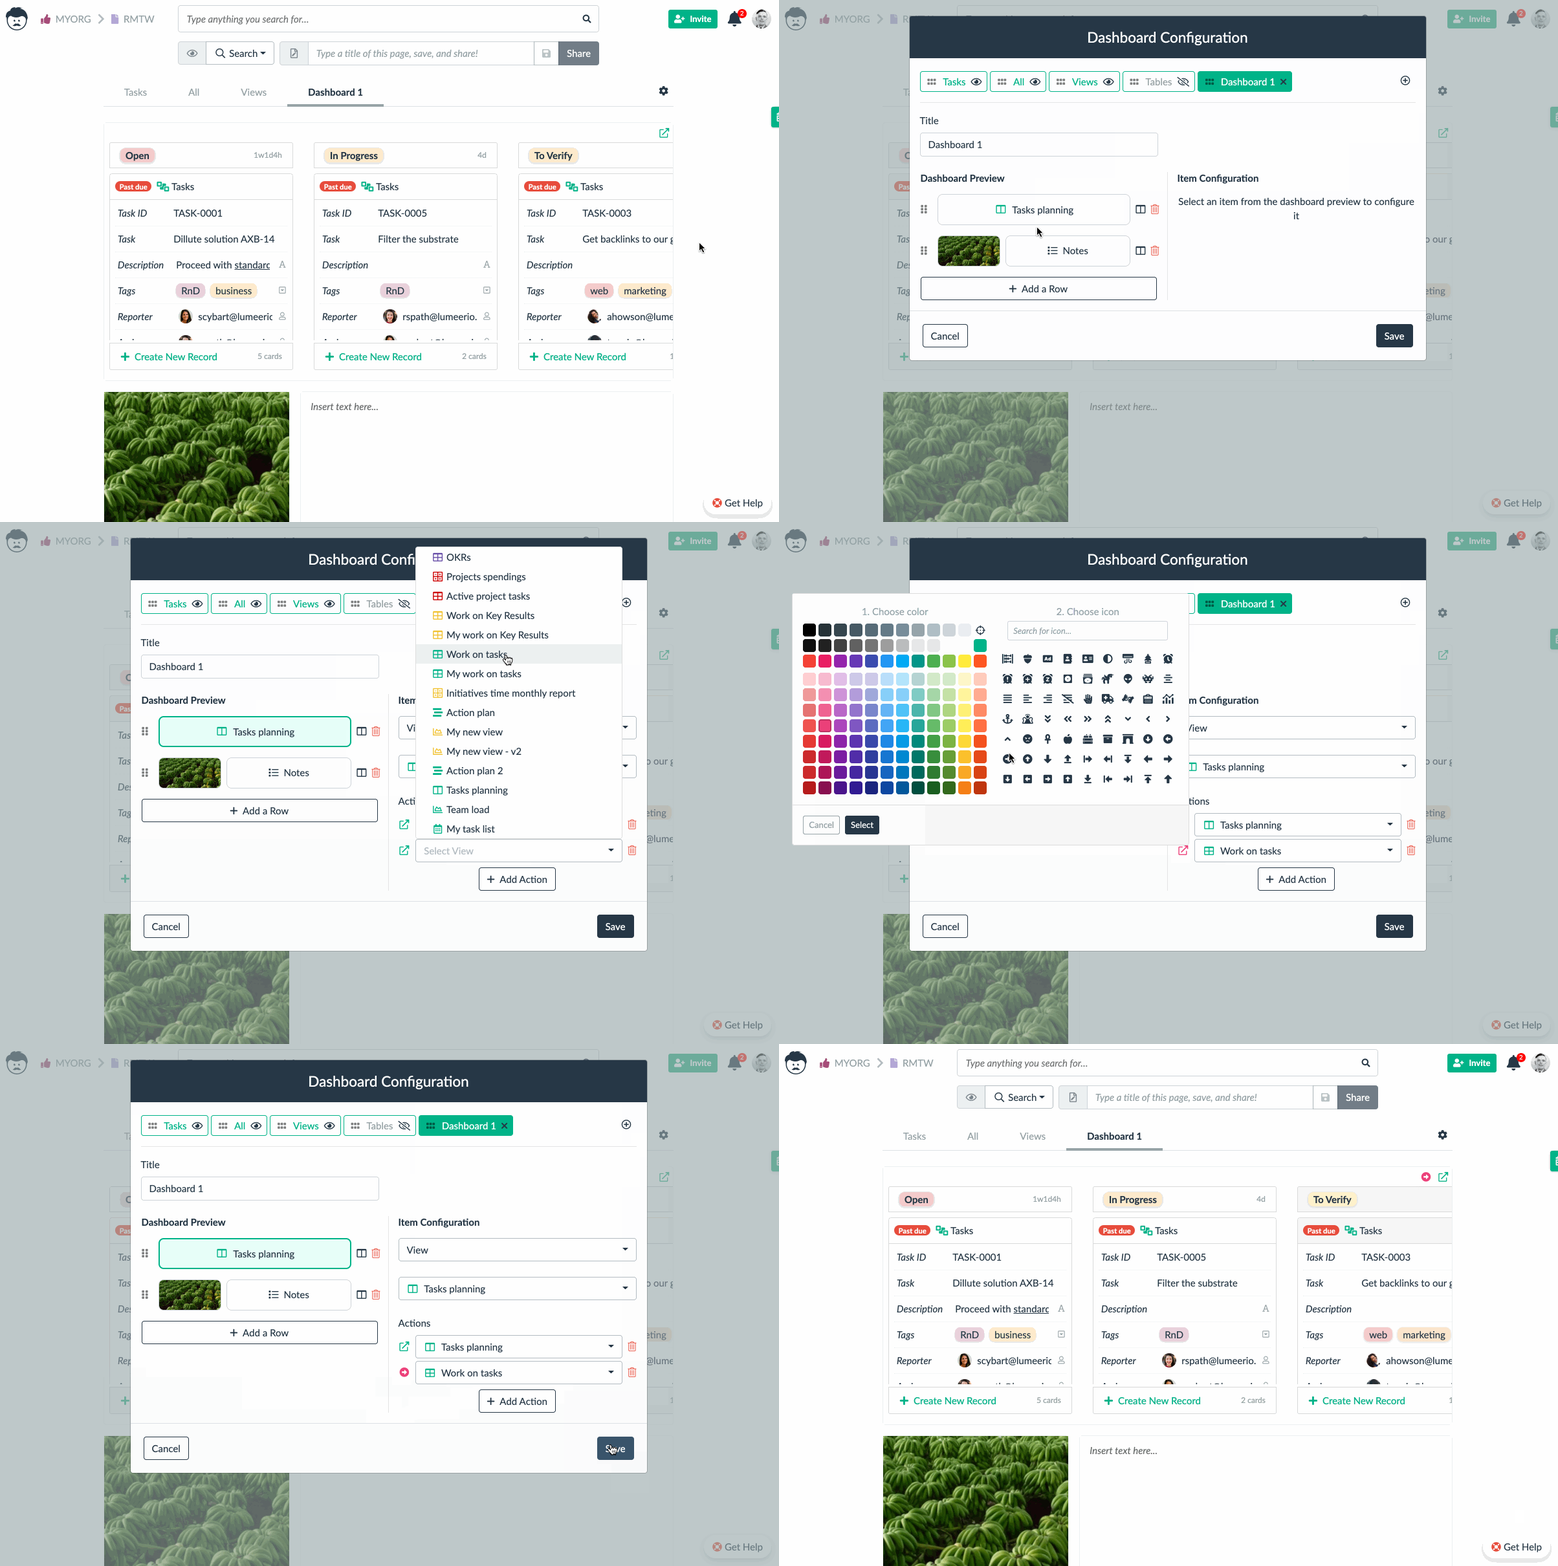
Default Home Screen and Sharing Custom Dashboards
At this stage, the dashboard already became your default home screen. When you open a view and click on the Lumeer icon in the top left corner, you get back to this dashboard.

Saving the Dashboard
When you type in the view name and save it, the dashboard is stored as an ordinary view.You can now share this view with your colleagues who can set it as their default home screen.

Setting a Home Screen from a Stored Dashboard
Your colleague can now open the stored view and set it as their home screen.
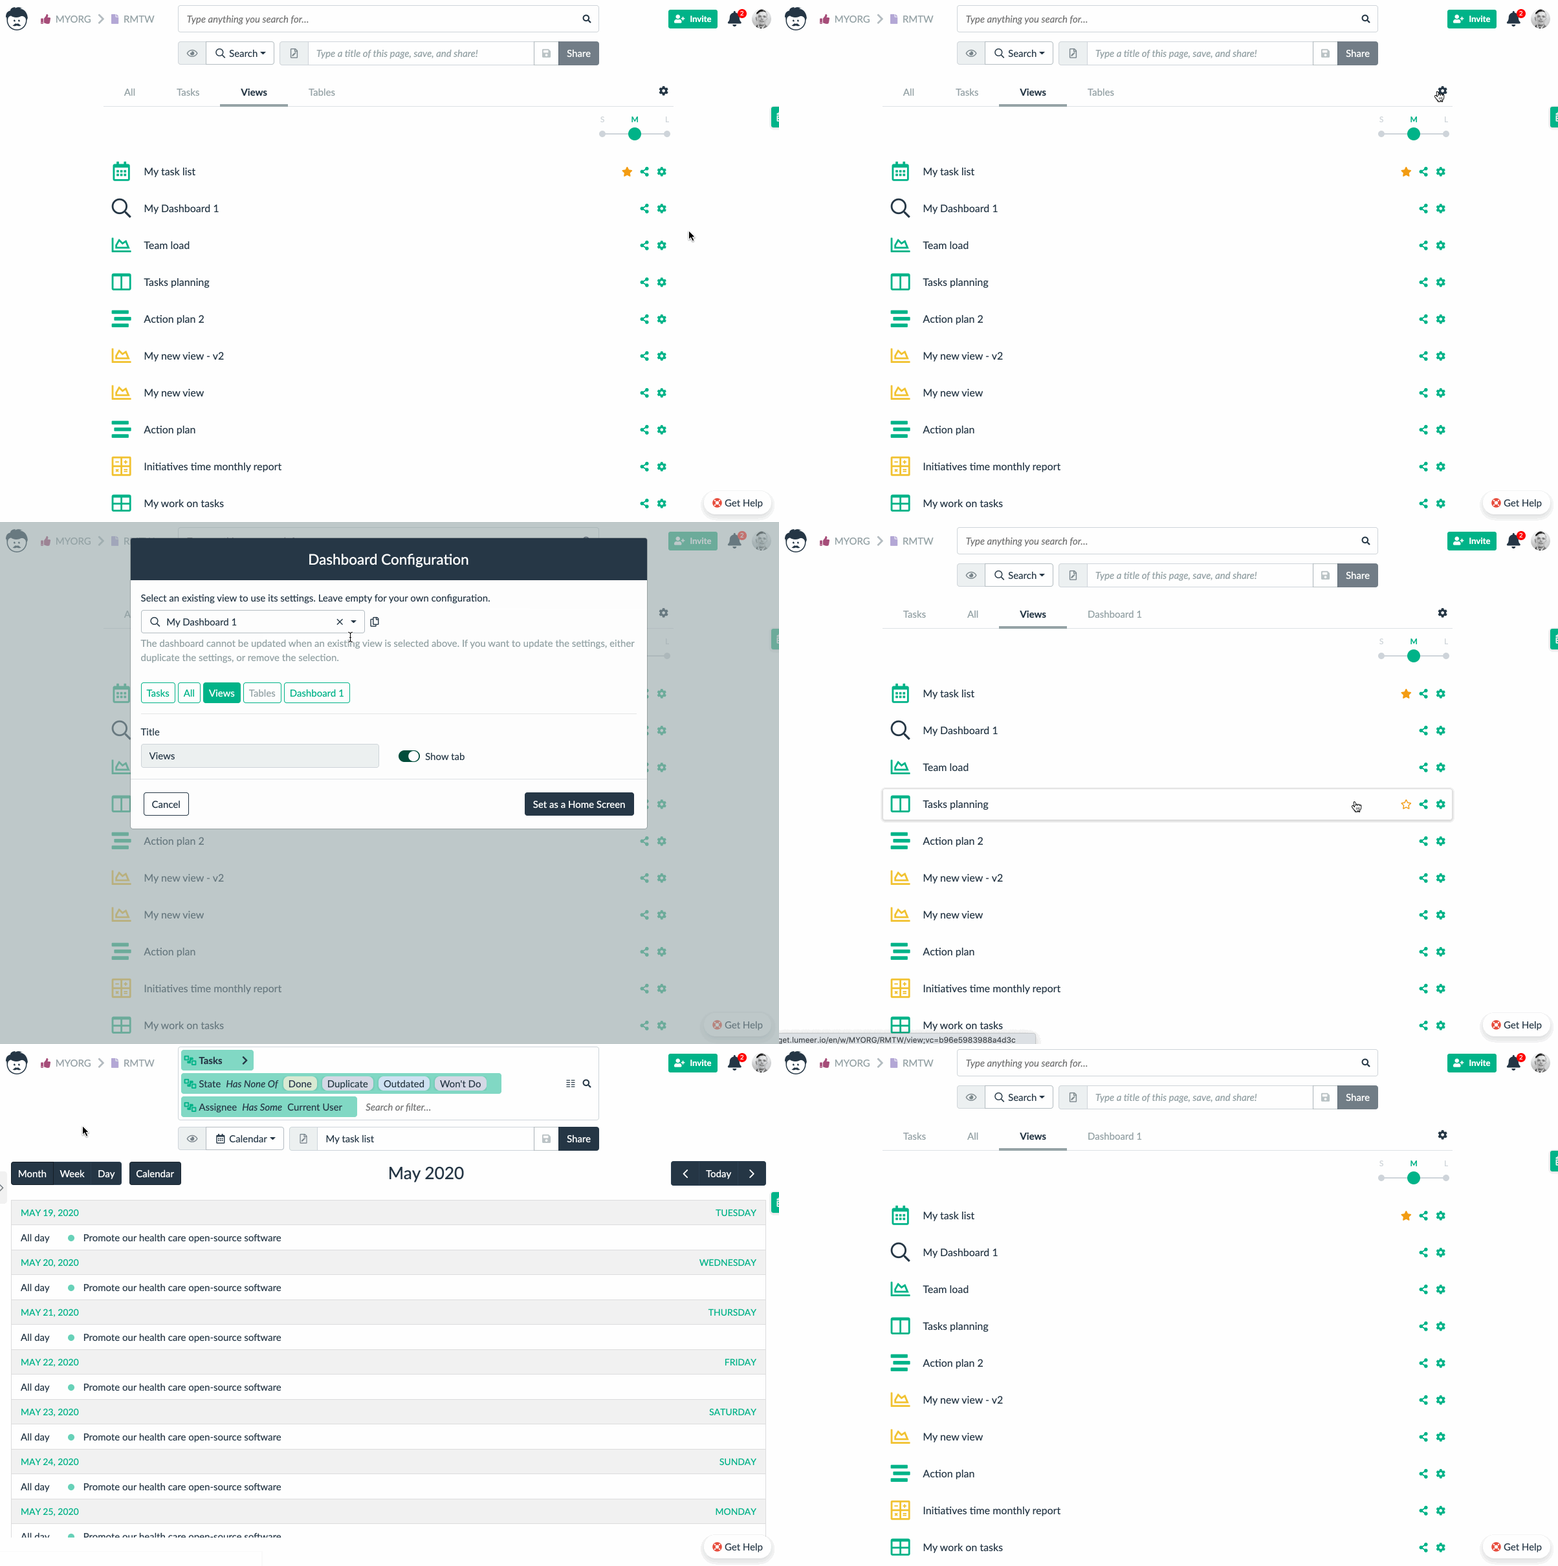
When they want to do any modifications to their home screen, they need to copy the original settings before they can change it.
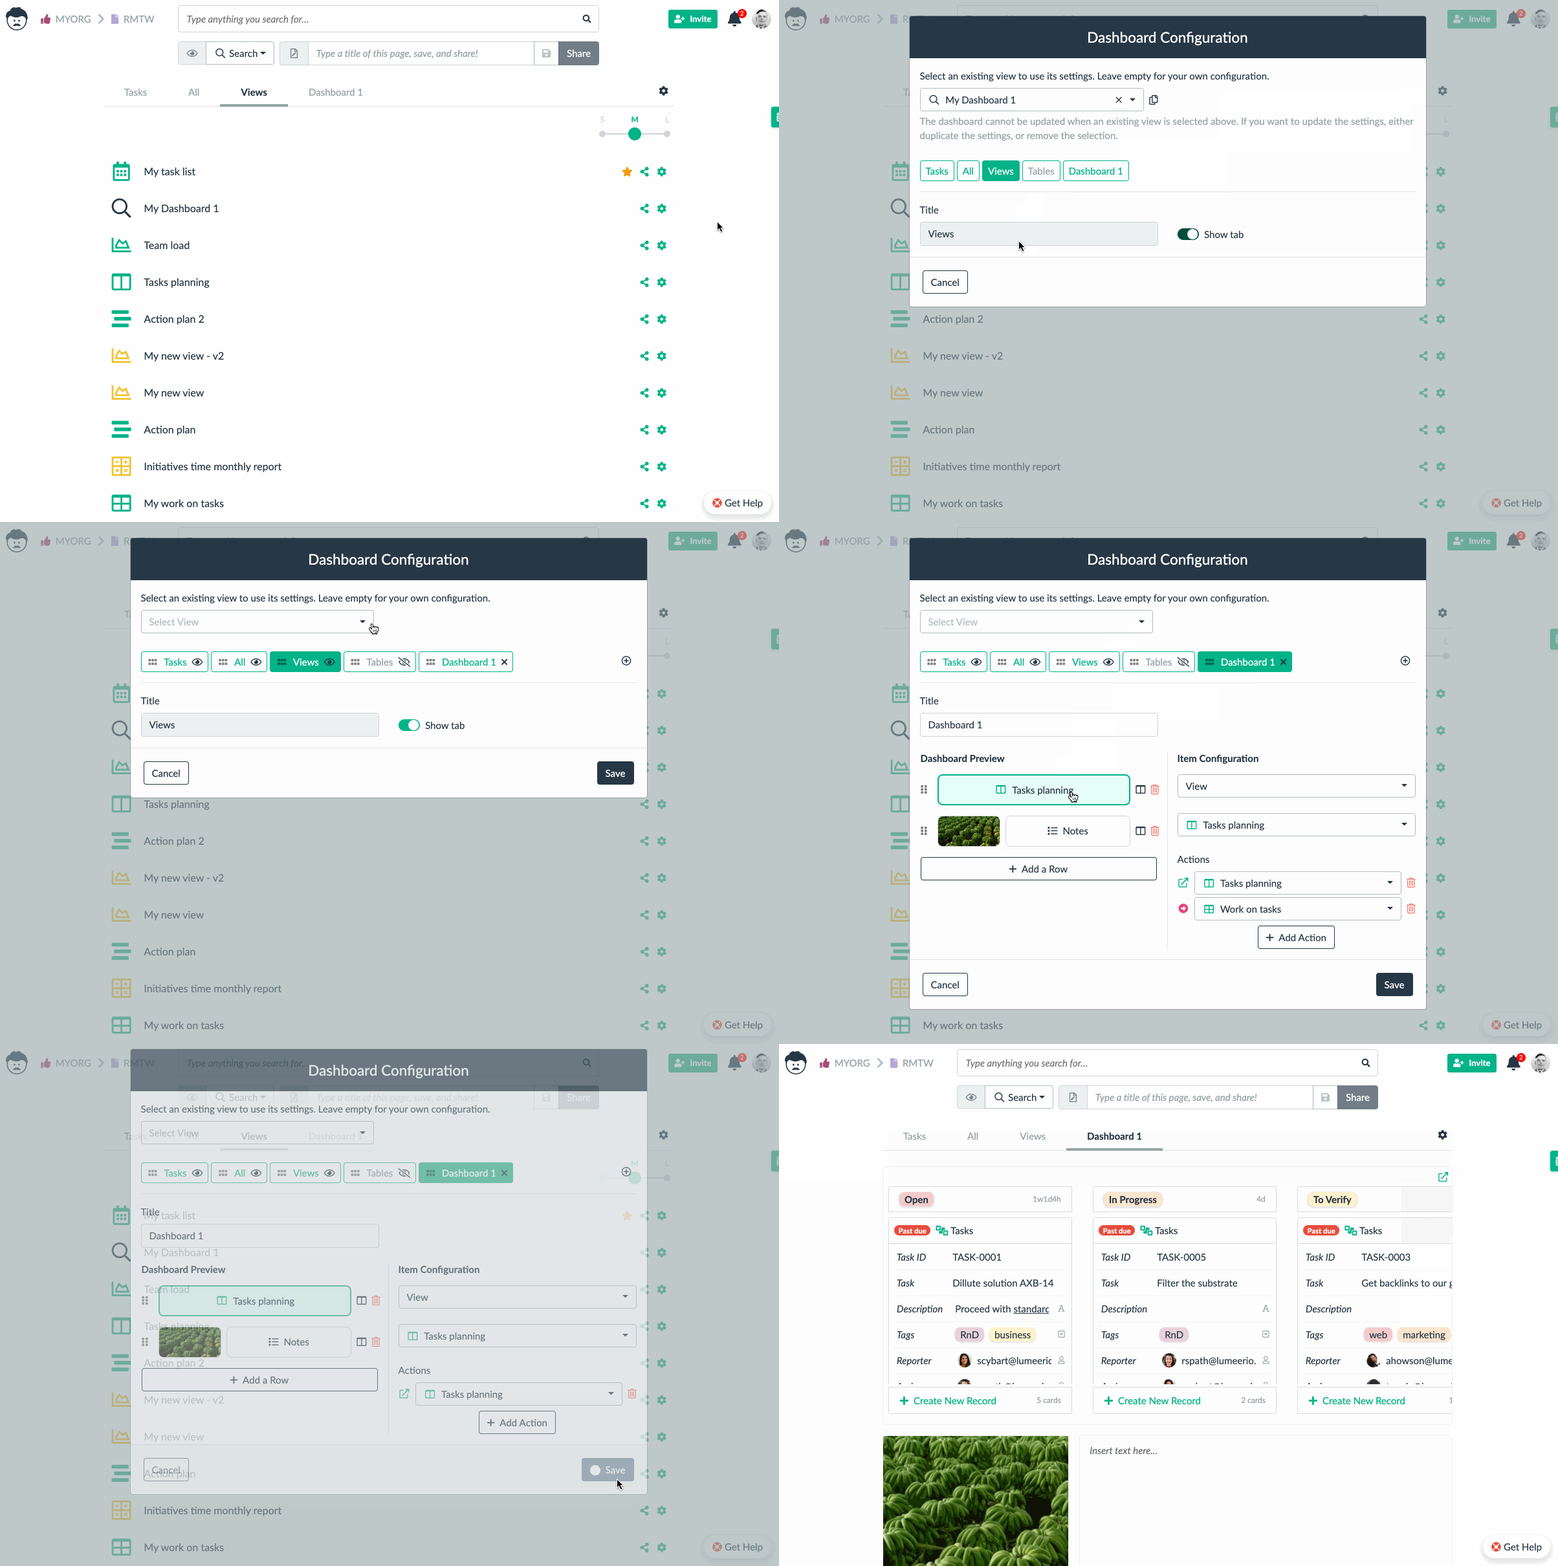
Or you can just use the stored dashboard view as a regular view. That way, you won’t set it as your home screen and you can open it whenever you want from the list of views.
Advanced Use Cases
Custom Tasks List
In the default Tasks tab, you can see all your active tasks. It might be useful to have the ability to display only urgent tasks, or tasks for the whole team for example. This can be easily configured in the custom dashboards.
A dashboard view can be itself embedded into another dashboard. However, only the active tab is displayed.
Let’s use this feature and start with filtering the tasks in the default home screen.
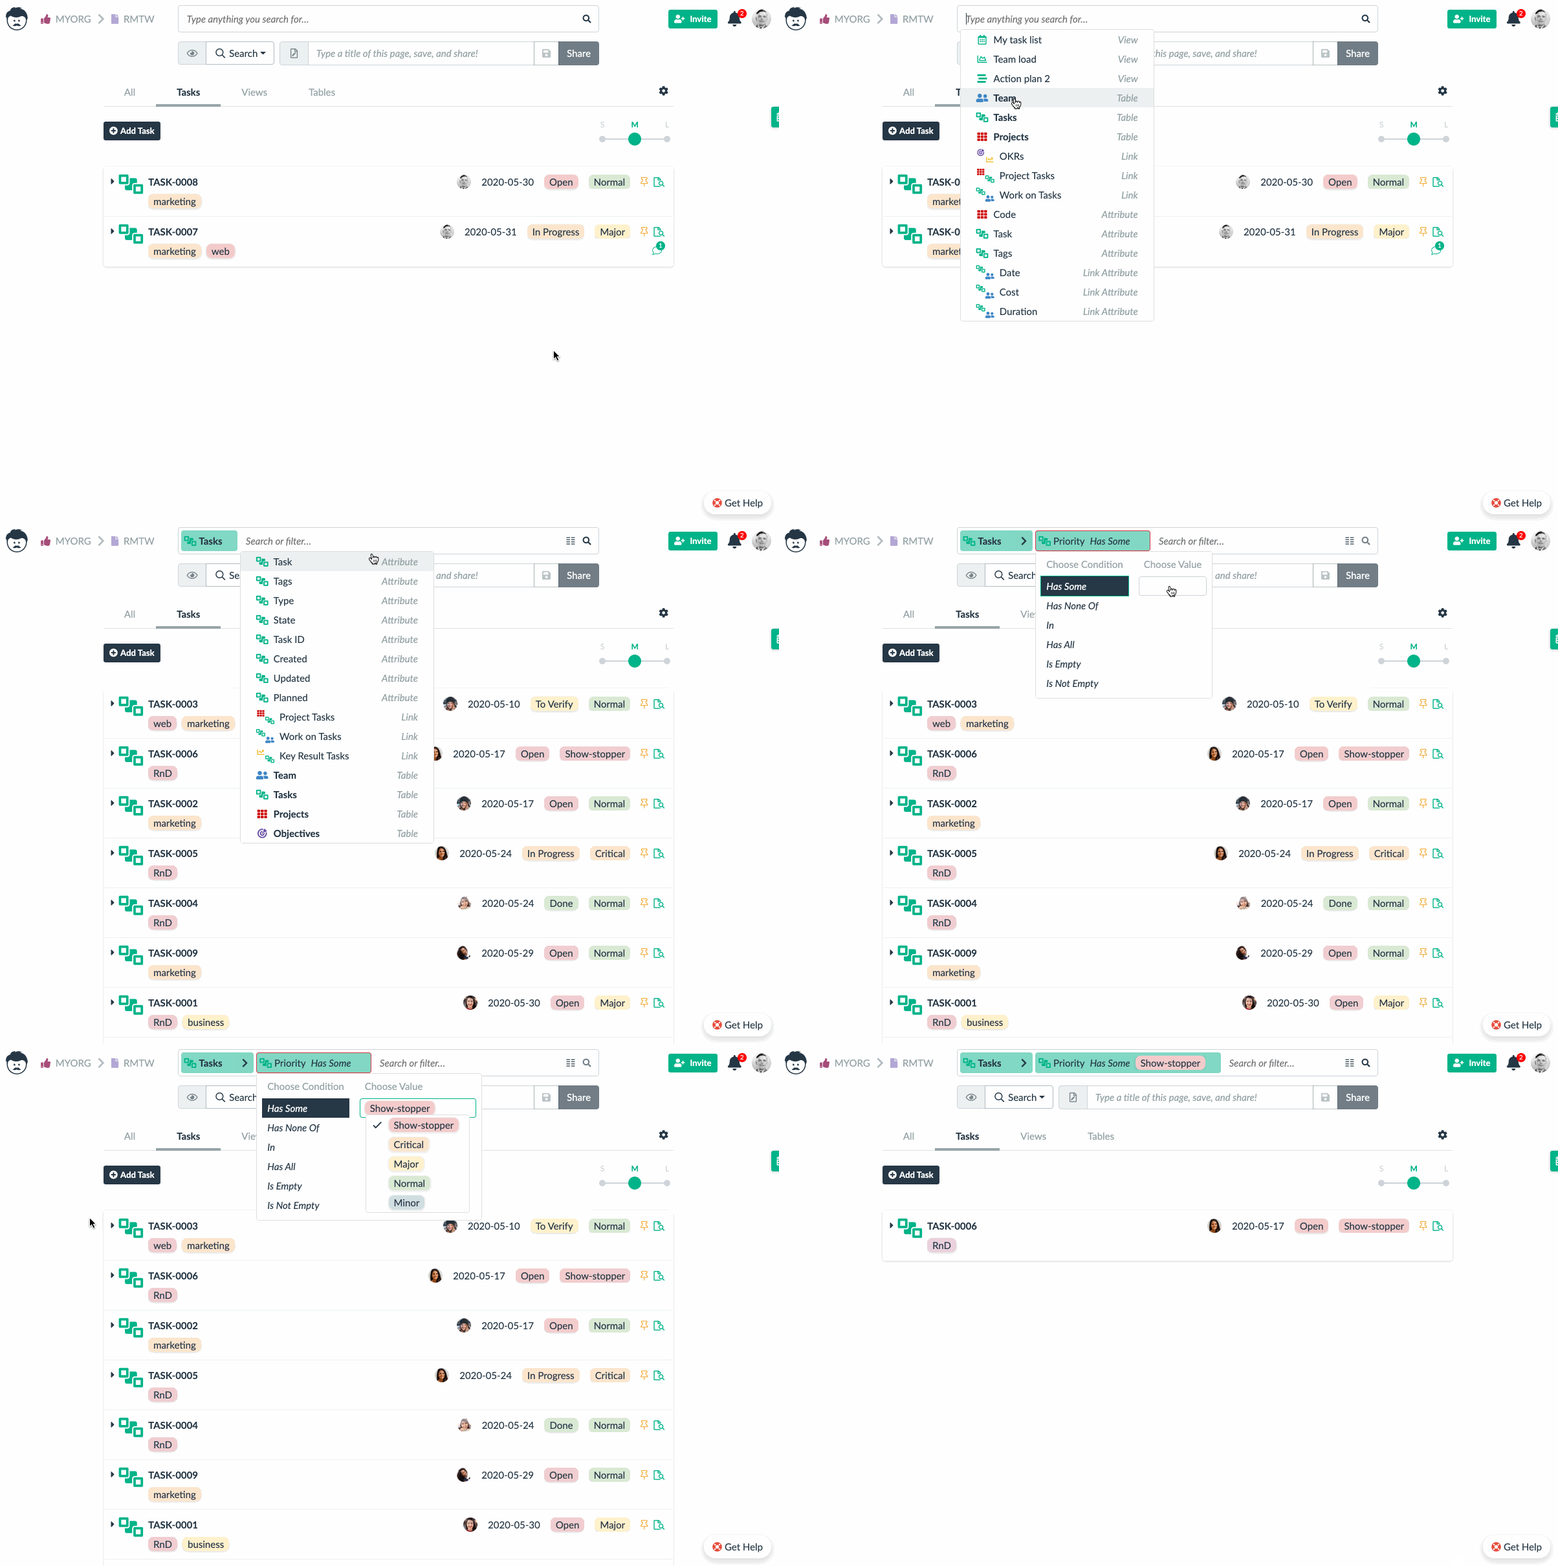
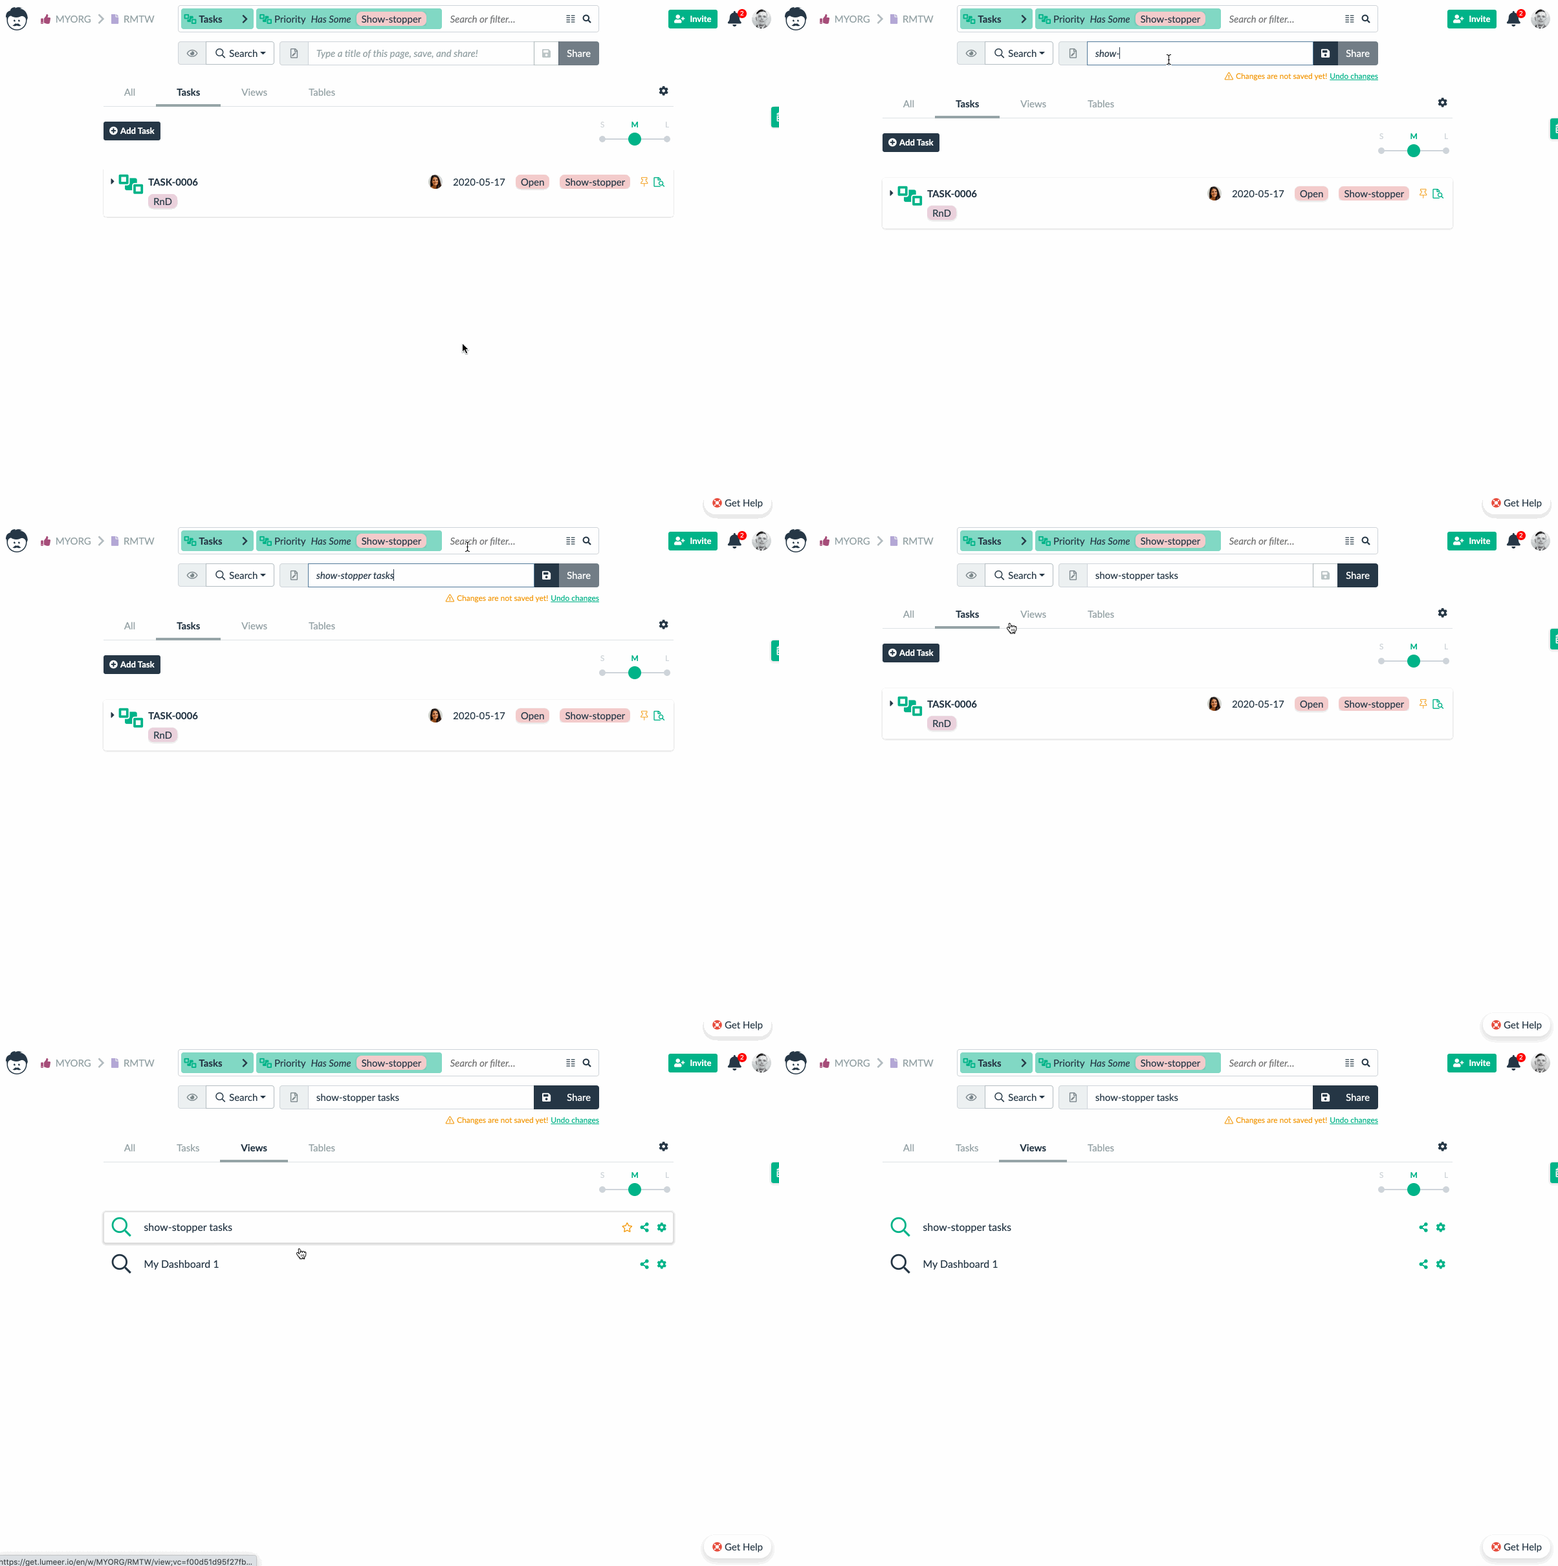
Now you can save this Search view with tasks filtered as a regular view.
And the last step is to include this saved view in the dashboard.
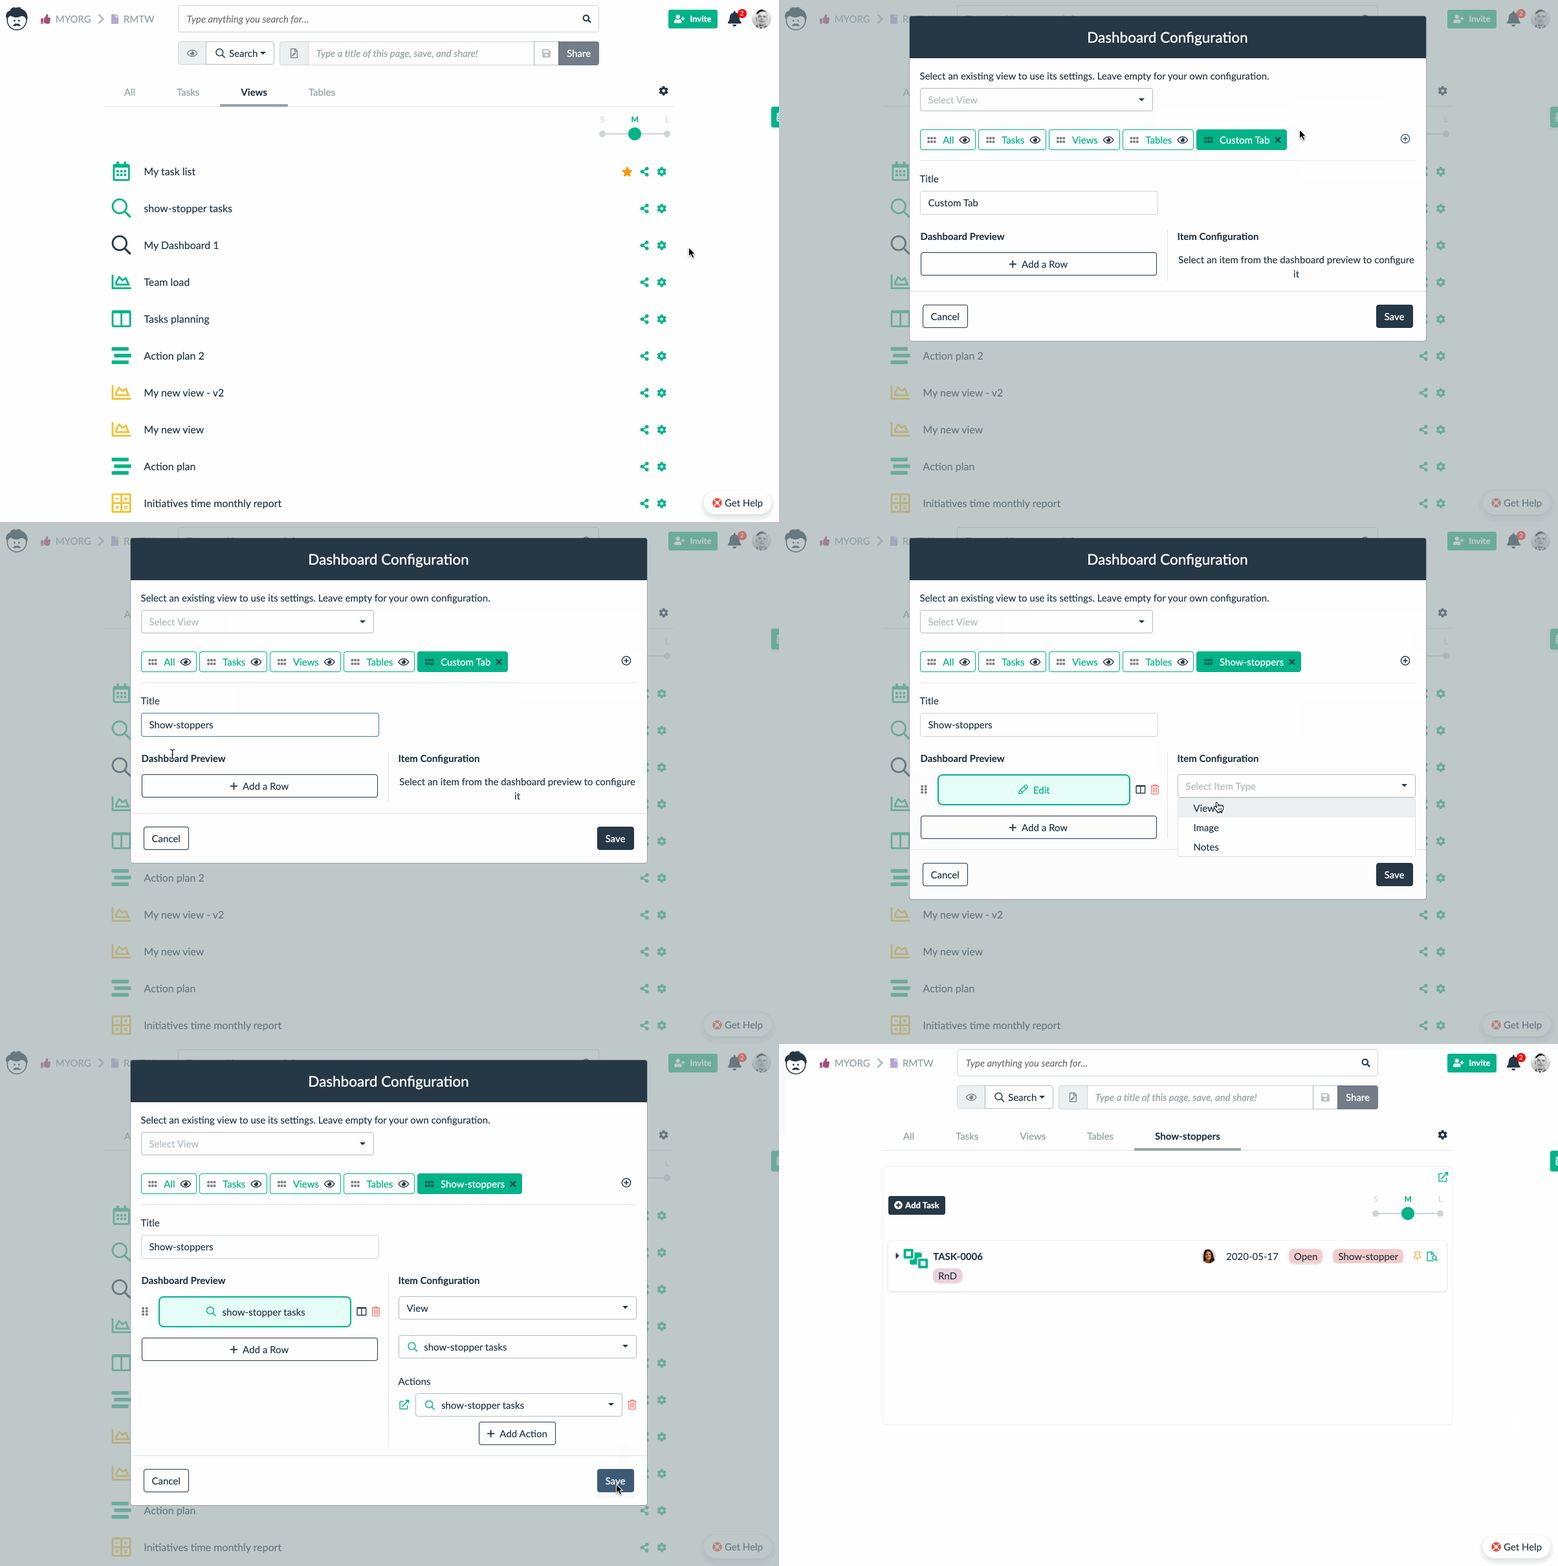
As you can see, you now have a custom dashboard tab with show-stopper priority tasks for the whole team. This way you can stay on top of what is most critical for your team. You can also use the form view on your dashboard to quickly add a new task.