Basic Principles of Your Projects and Data Structure

Learn the basic principles of Lumeer to get the best value of the application. Spending a few minutes here will pay you off many times in the future.
Lumeer Structure
Organization and Project
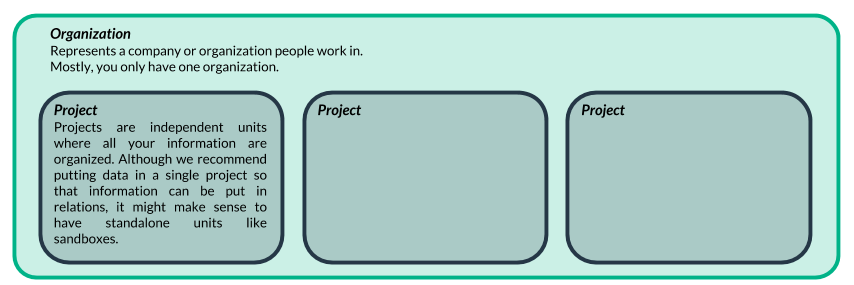
Everything starts with an Organization that represents your company or simply an organization you work with. In an Organization, there can be multiple Projects. A Project always belongs to an Organization. When you log in to Lumeer for the first time, you have a single Organization and a single Project in it.
Projects are independent units where all your information are organized. Although we recommend putting data in a single Project so that information can be placed in relations, it might make sense to have standalone units like sandboxes.
Data cannot be shared between Projects and it is a good rule of thumb that when your organization is less than 100 employees, you are mostly fine to have just a single main Project.
Every Organization and Project have a configurable icon and color so that they are easily recognizable and easy to remember.
Tables
Let’s have a look on the basic principles of how data are stored in Lumeer.
A Project can contain any number of Tables (please note that there is a limit to the number of Tables imposed by the Free Plan). Table is a basic set of data or information describing similar items or entities (invoices, store items, pets, etc.).
Every Table has a name and a configurable icon and color so that you can easily recognize it in a visual way without the need to read the names.
Perspectives and Views
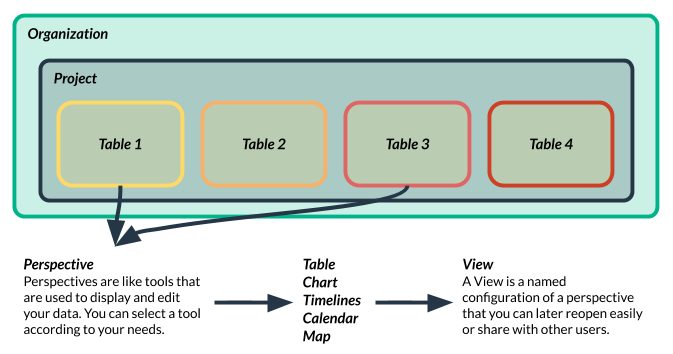
You can search for your data using a Google-like query, or directly open a Table. The way you access your Table is like a tool you choose to work with your data. You can open the Table in a Table, Calendar, Timelines, Map etc. These tools are called Perspectives. Like the Table Perspective for instance.
When you open the Table using the Table Perspective, you can configure the visual representation – you can stretch some columns, hide some others, link another Table, or add a filter to the search query. Once you have these fine tuning complete, you can give your visual configuration a name and save it. The saved configuration is called a View. It represents a certain point of view of your data given the used Perspective and its configuration.
It is also possible to share a View with other users. A View has an interesting implication because it can give a limited access to users who would not normally see the Tables and data in the Tables used in the particular View.
Accessing Data
Records, Attributes, and Values
In order to easily understand how to work with your user data, we need to establish a common terminology.
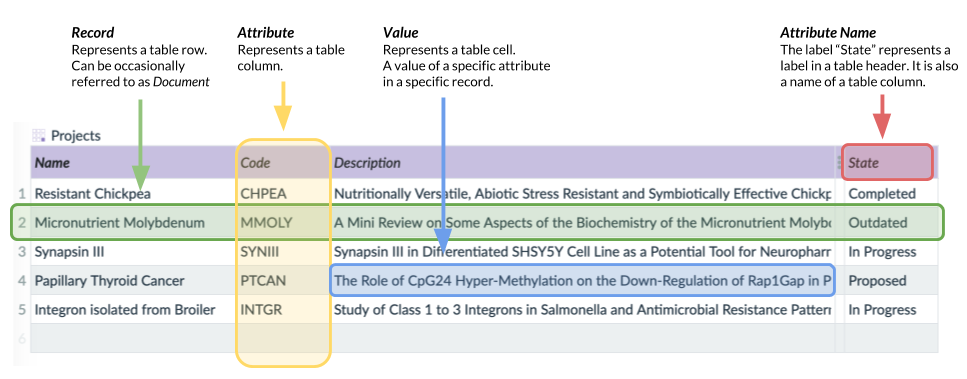
In Figure 3, the terms are demonstrated on a Table perspective. A table row represents a single Record, occasionally referred to as Document. Accordingly, a table column represents an Attribute. Finally, a single cell in the table represents a Value of a particular Attribute in a specific Record. Looking at it from the perspective of rows, a Record is a set of Attribute Values, or a set of named Values, where the name of the Value is determined by an Attribute Name.
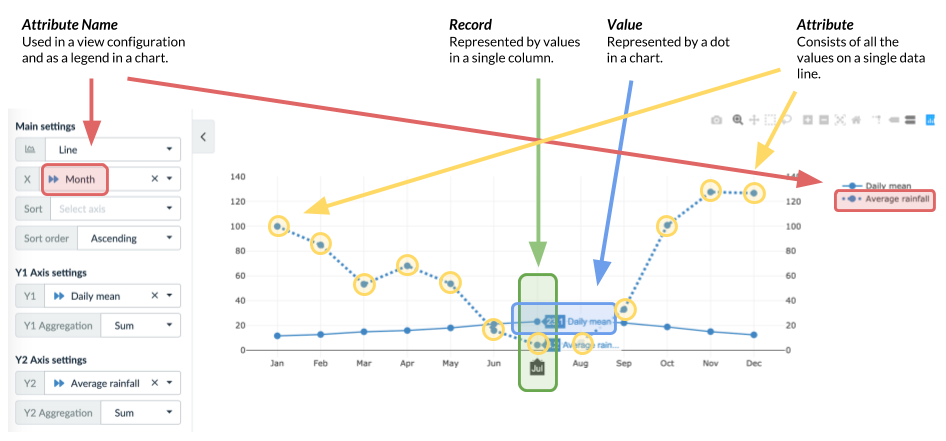
It is important to understand the basic terminology because various items like Record, Attribute and or Value can be displayed differently in other perspectives as it can be seen in Figure 4.
Tables
The one before the last term to remember is a Table. It is represented by a single table. Records from two Tables can be linked together. In the following Figure you can see the Projects Table and the Employees Table linked together.
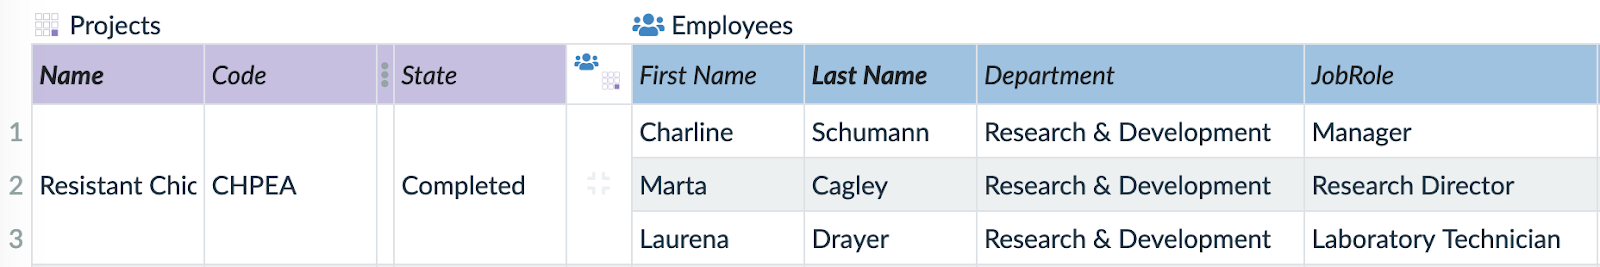
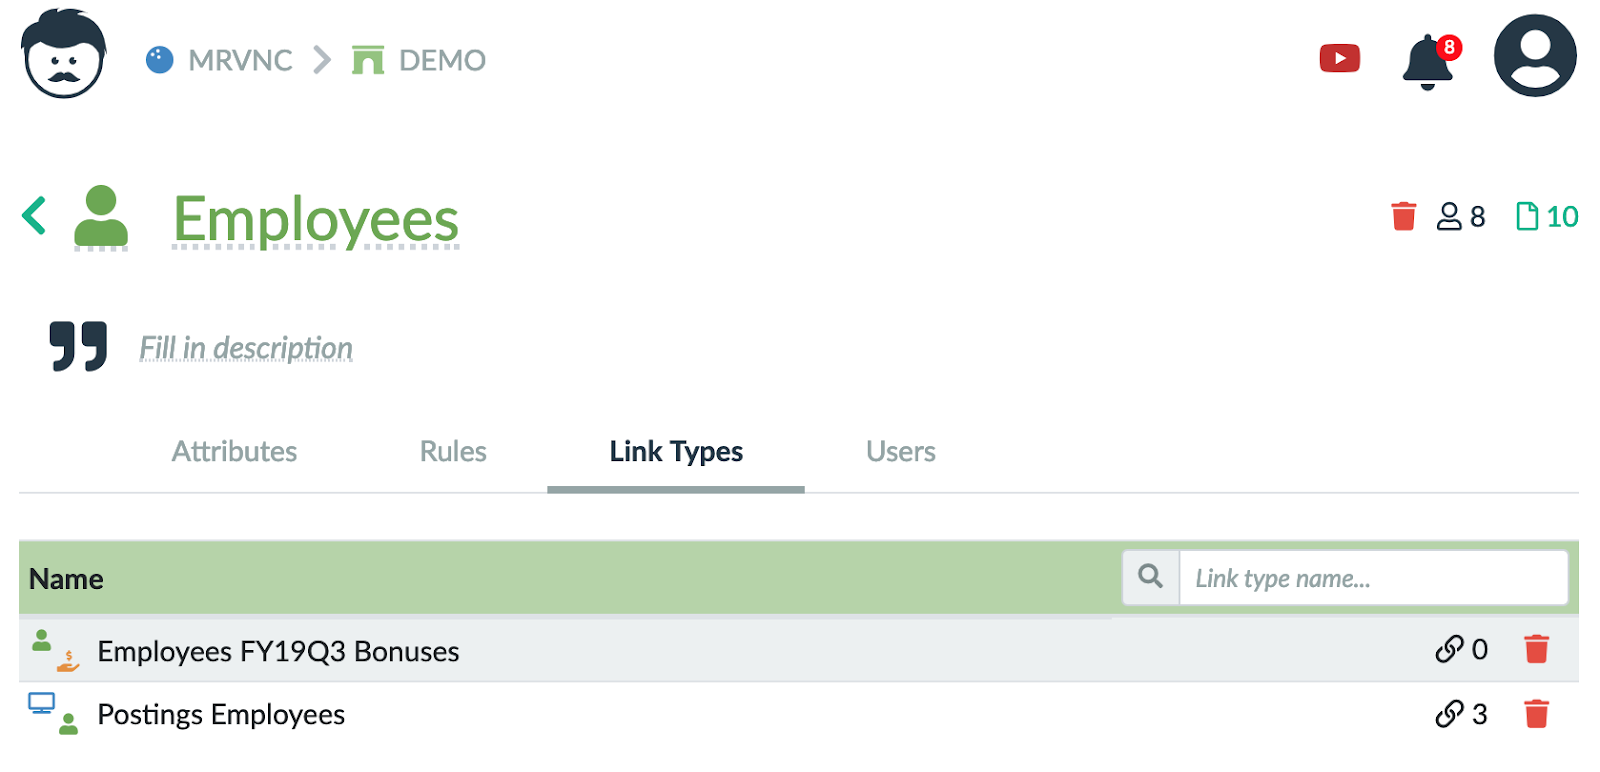
The link between Tables can have various meanings. Once it can represent project owners, in another case it can represent who works on a project. This is why the Links also have a name. You can see a list of Links that connect a particular Table in its settings.
Basic Principles of Links
Links are offered in the Table perspective when you click the plus button to link another Table. You can display an existing Link or create a new one.
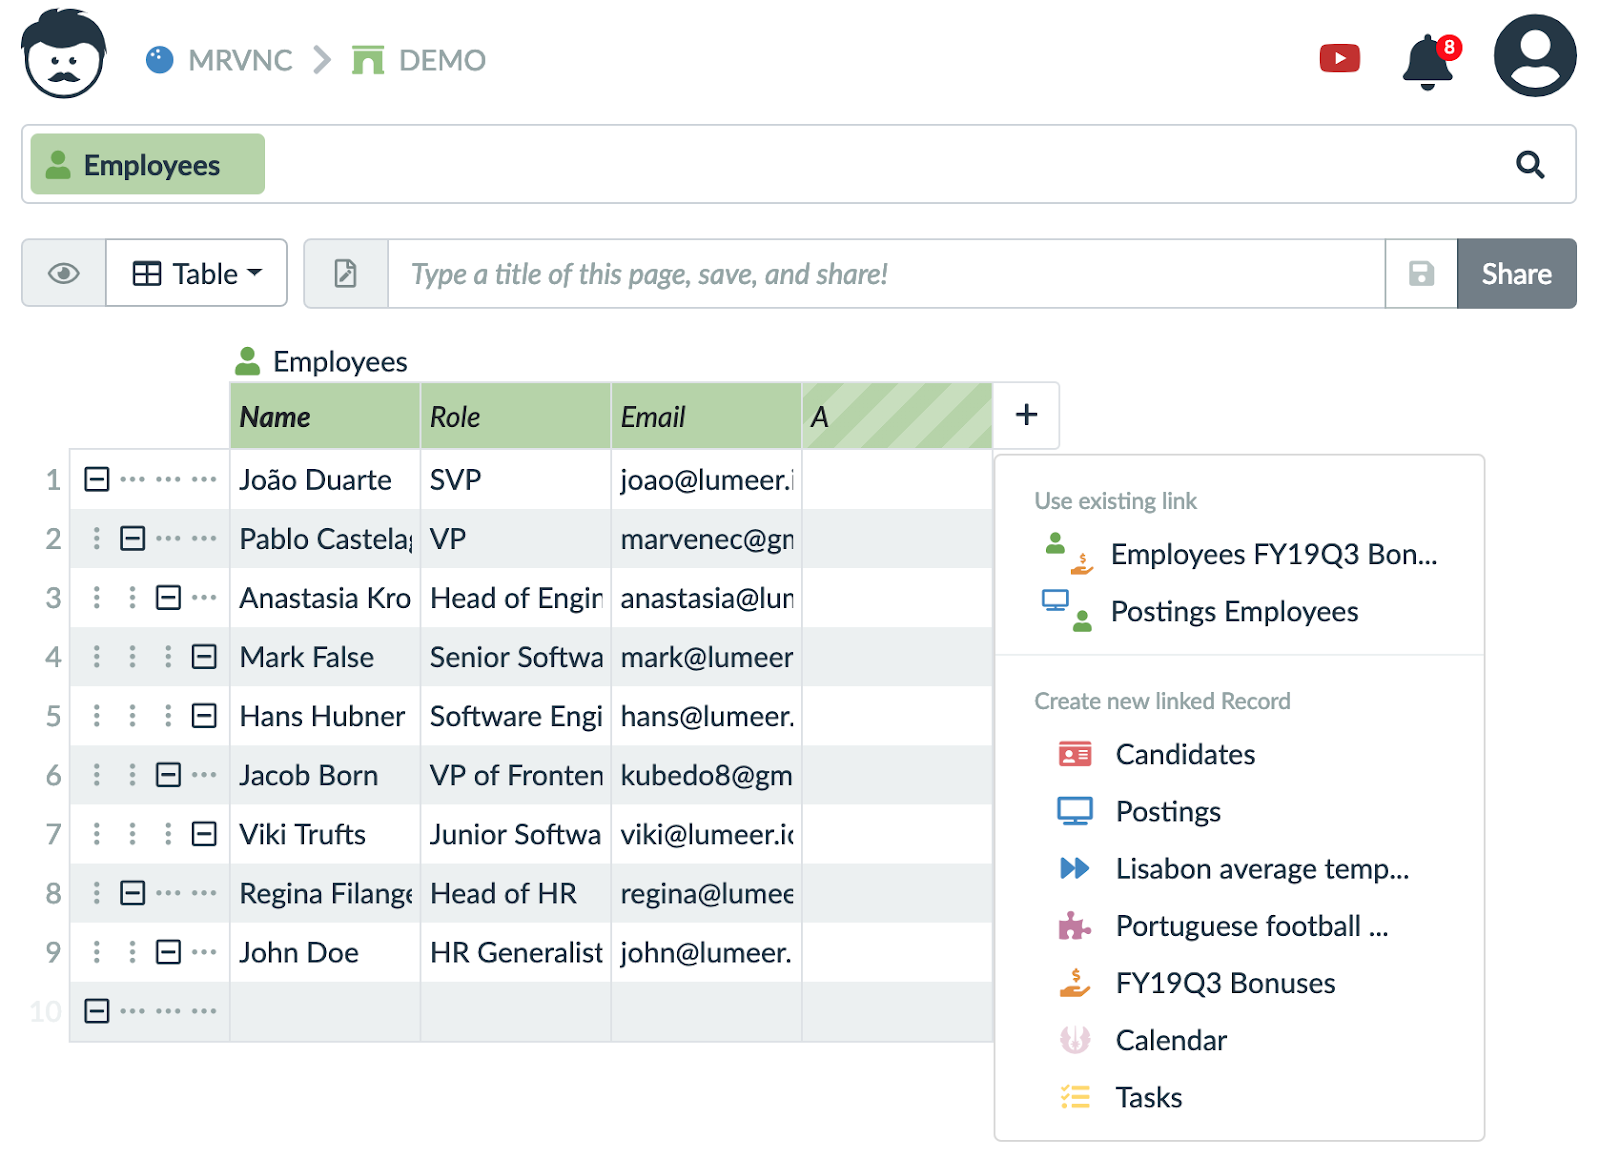
For a detailed step by step manual on creating links, see Table View Usage, section Links.
More Links…
So far, we have seen the basic principles of a so called Link Type – as we worked with a Link Name. This tells us, what Tables are connected (linked) and what is the meaning of the connection. It would not make any sense when we just put the Tables (or tables) next to each other. We need to deliberately select which Records are connected. You can imagine this as lines between the two Tables as depicted in Figure 8.
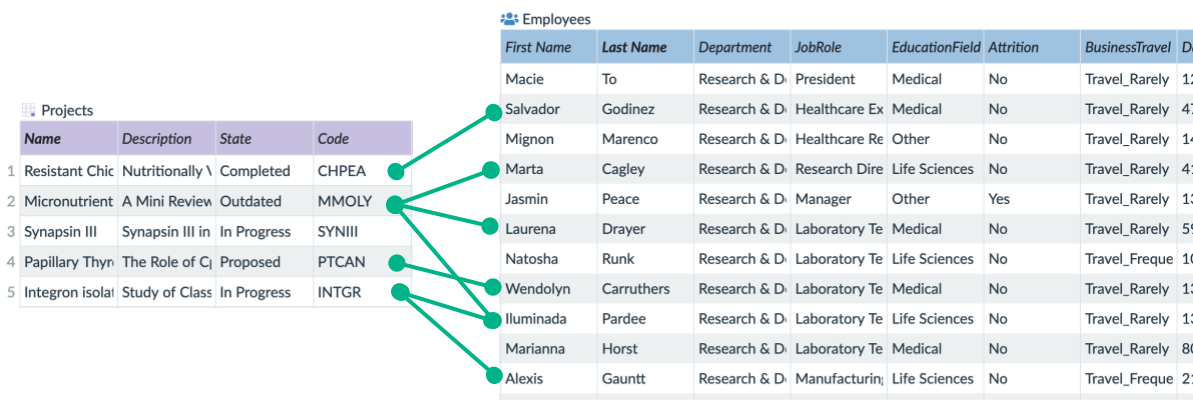
All the lines between the Tables represent Links between specific Records. We call the lines Link Instances of a particular Link Type (or Link Name). There can be a different set of lines (connections) between the same Tables under a different Link Type (Link Name).
The Links have some interesting properties. As you can see, not all Records from the left Table are connected to Records in the right Table. The same applies in the other direction as well – not all Records in the right Table are connected to Records in the left Table. Also, there can be links in both Tables that are connected to multiple Records on the other side. This is the case for lines 2 and 5 in the left Table and for the third Record from the bottom in the right Table. Now let’s have a look, how this is represented in Lumeer.
Visual Representation of Links
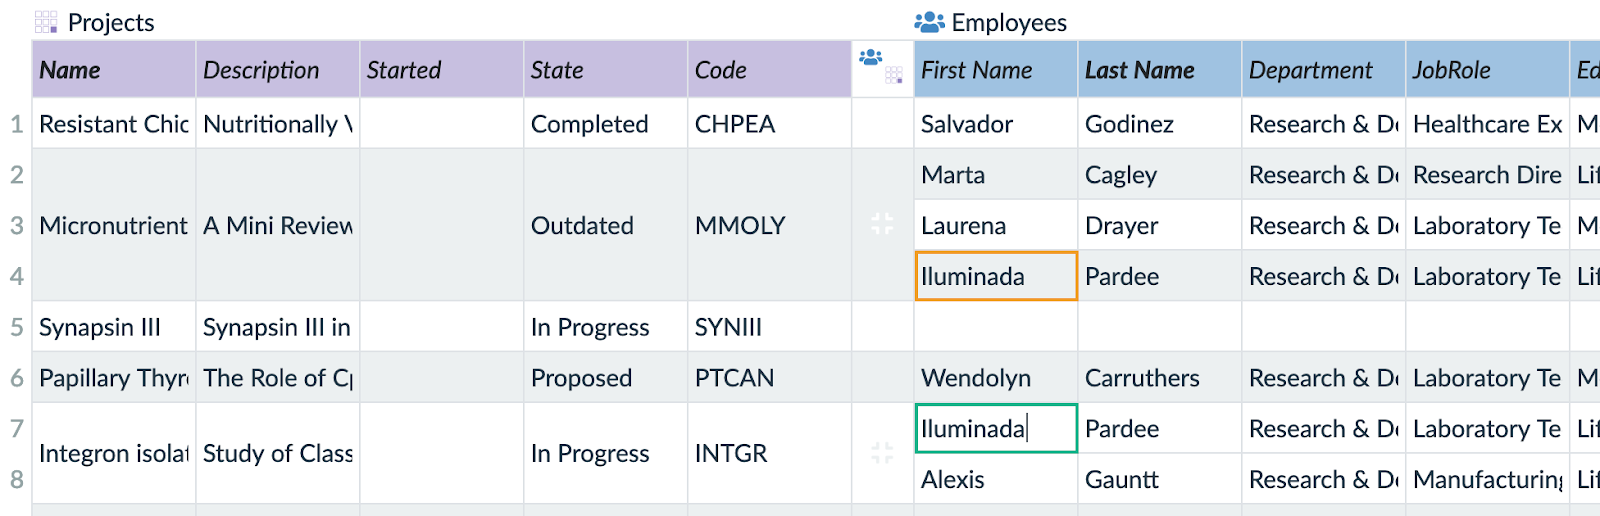
As you can see, when there are multiple Records on the right side connected to a single Record on the left side (lines 2-4), the visualisation is pretty obvious.
In the opposite situation, where a single Record on the right side is connected to multiple different Records on the left side, the same Record is displayed multiple times on the right side.
This is the case of “Iluminada Pardee”. When editing the Value in the First Name Attribute, there is a green box around the active table cell.
The yellow box highlights cells referencing the same Record. In other words, the Records on the right side are not duplicated or copied, they are just displayed multiple times and all changes in the green box are reflected in all yellow boxes.
In this article we have seen the basic principles of how data are organized in Lumeer. Now you might want to get back to the list of recommended articles to study, or you might be interested more in the user management.