Data Types: Give Meaning to Your Data

When we think and process data from the outside world in our brains, we automatically use different processes depending on what the data represents. Data types help computer to achieve the same results.
There are many types of data
Consider following examples:
- If you see “data + processing”, you will join those two words into phrase “data processing”. But if you see “2 + 3”, you will perform mathematical addition and get “5”, rather than “23”, won’t you?
- If somebody asks you “What is your favorite color?”, your response will be blue or red or other color name rather than something like an onion”, won’t it?
- If the first task takes you 1 hour and 30 minutes to complete and the second task takes 1 hour and 40 minutes, you will say that together it took 3 hours and 10 minutes instead of 2 hours and 70 minutes, won’t you?
These answers probably seem completely obvious and logical to you and you wouldn’t even consider that onion is a color or say that something took 2 hours and 70 minutes. But computers and therefore software tools don’t naturally possess the ability to think this way. Try calculating sum of “1h30m” and “1h40m” in a spreadsheet and you won’t even get “2h70m”, but a zero:

The spreadsheet knows nothing about what this sequence of numbers and letters means. Therefore it is very difficult, even impossible, to sufficiently capture your company’s processes in most of the available software tools (including widely used spreadsheets).
What Are Data Types?
To work with your data effectively and automate your processes, Lumeer lets you enter anything and tell him what it is. Sometimes he even figures it out himself and gives you a suggestion.

Once Lumeer is sure about what do you intend to store in your tables, he provides you the best treatment for your information.
So how to tell Lumeer what does the data mean? To do that, we introduced Data types. That means that you can set the type not just for one value, but for the whole column at once!
Available Data Types
How to Set the Data Type for an Attribute
When you create a new attribute (i.e. a column in a table), its type is empty by default. You can then change it to whatever suits the data you will be entering.
What’s more, it can even restrict the value of the data (e.g. attribute type Number can have minimal and/or maximal value) or the format (e.g. Date can be set to DD/MM/YYYY). More on individual data types below.
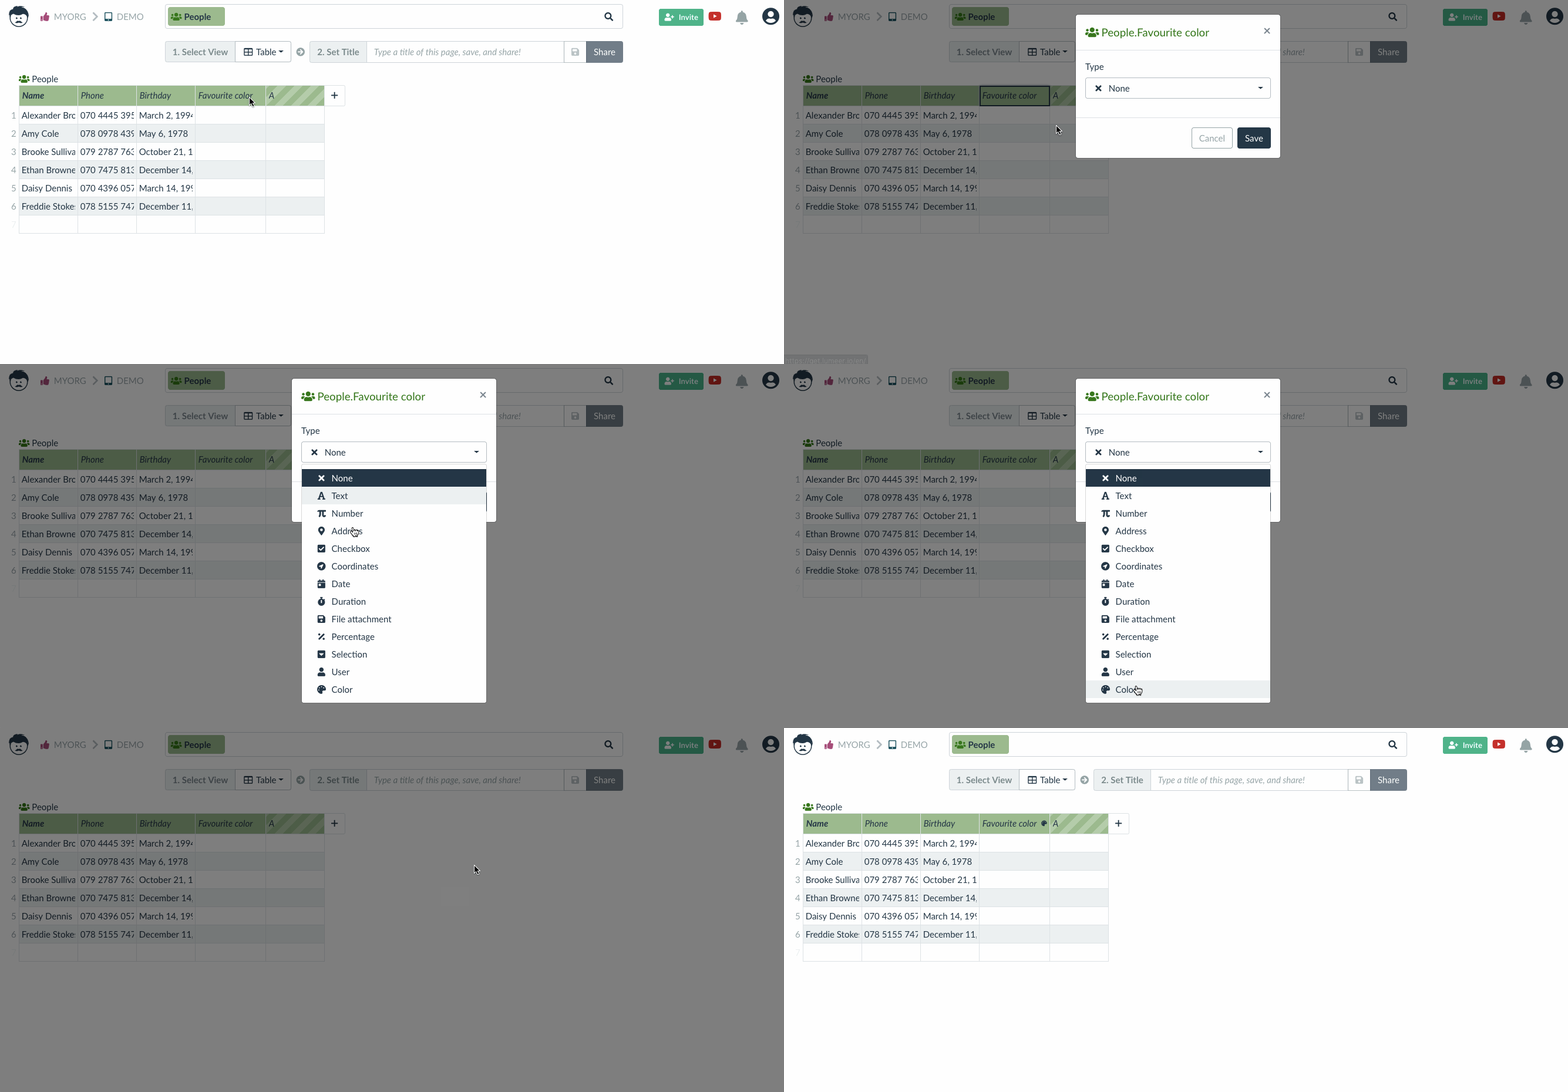
To set a data type of the attribute, right-click on the column name in table perspective and choose the type:
Common Settings for Some Data Types
Suggest Values
Some data types share the same settings. The following data types have an option to suggest values when typing: None, Address, Number, Percentage, Coordinates, Text, Duration.

When turned on, existing values for this attribute are shown in a little dropdown box when typing a new value. This is useful when entering a new client for example, to see whether we already have a record for them.

Currently, the suggestion work in Table, Workflow, and Form views.
This is always available for linked records (when linking a record in a detail panel, or via linked tables).
Attribute Data Types
Numbers
Number lets you enter only numerical values and set their constraints, and Percentage allows you to display decimal numbers as a percentage.
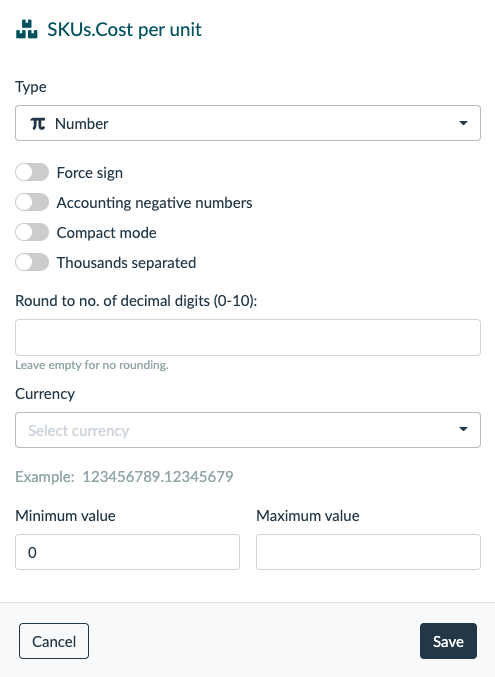
When setting the type to Number, you have the following options:
- Force sign – if turned on, there must be either plus or minus sign in front of the number.
- Accounting negative numbers – if turned on, it puts brackets around negative numbers.
- Compact mode – if turned on, it compacts big numbers, e.g. 10100 is displayed as 10k
- Thousands separated – if turned on, it uses a default separator based on the currency, or comma if the currency is not set.
- Rounding
- Currency
- Minimum and maximum
With the Percentage attribute data type, you can also set rounding and or display the value as a chart:

By clicking on the palette icon in the progress bar option, you can set a custom color.

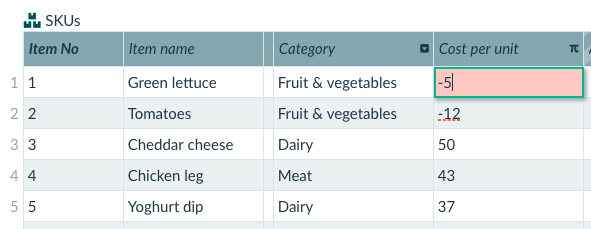
If you attempt to enter value which doesn’t respect the constraint, it will be marked in red and you won’t be able to proceed (row 1). Existing values (which were entered before the constraint was created) that don’t respect the constraint (row 2) are highlighted as invalid.
You can of course enter numerical values into the column even if the type is not set at all (equal to set to None) or Text. Also, you will be able to perform calculations on those values – similarly to how you would do in a spreadsheet. However, the Number and Percentage attribute types gives you more power over the integrity of the values.
Examples of Using Number Data Type
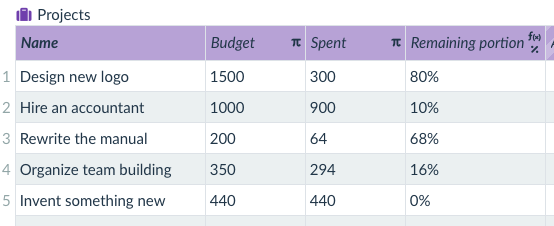
Let’s demonstrate this on an example. We have this table containing data about projects:

Remaining portion is calculated as following: (Budget – Spent)/Budget
If we have budget 1500 and spent 300, the remaining portion will of course be 0.8:

But what happens if we enter 1000 and “abc”? Well, the result cannot be calculated and “NaN” (not a number) is displayed.

“abc” is an invalid value. Although, we don’t want invalid values in our data, mistakes can happen. Especially if multiple people work with the same table.
Setting the attribute data type to Number solves the problem – if somebody tries to enter an invalid value, they just cannot proceed. If the value was entered before the type was set, it is highlighted (red underline) as invalid so you can easily spot and fix such an irregularity.

The next thing you can enforce with the Number type is that the values are from a certain range. Just set the minimum and/or maximum. The behaviour for invalid values is the same – old ones are highlighted, new ones cannot be saved.
The Percentage type works in the same way as the Number type (the value actually is a number), the only difference is that Lumeer treats the values as fractions and displays them as percents. As a result, instead of the following table:

You would see:

It’s just a visual change, but if you look at a list of projects, there is a high chance that you will be able to process the information faster if you see percentage instead of a decimal number.
What Can You Do with Numbers and Percentages?
First, as we already mentioned, they can act as a function input (see the manual on functions for more detail). So do other data types as well.
Second, you can display their values in a chart view. We first add a couple more values to the table:
And then configure the chart:

Thirdly, you can aggregate values across the rows in a pivot table. This complex pivot table comparing stock vs. demand of items across multiple depots is from Lumeer’s Supply chain management template:

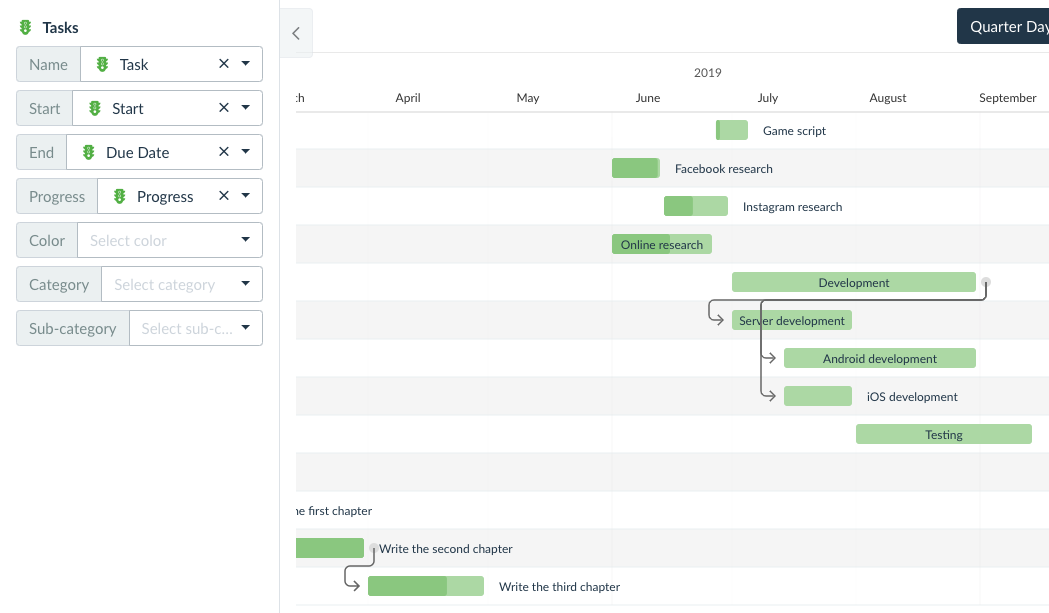
Last but not least, you can use the percentage value to display tasks progress in timeline view. If we switch this table from Project tracker template…
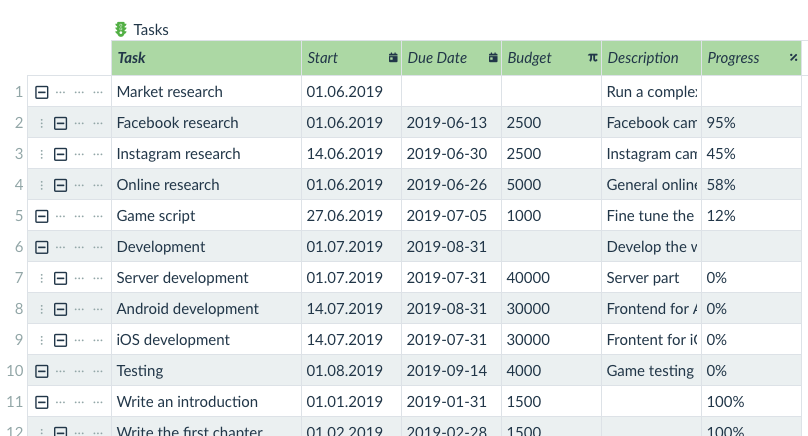
…to a timeline view and configure it, you see tasks’ progress in each row (it is displayed in darker green):
Date and Time
The Date attribute data type lets you enter date and time in multiple formats.
When setting the type, you can specify the format by either choosing one of the pre-defined or using a custom one.

You can even create your own date format from the following formulas:
| Formula | Meaning |
| YYYY, YY | Years 2021, 21 |
| MM, M, MMM, MMMM | Months 01-12, 1-12, Jan-Dec, January-December |
| DD, D | Days 00-31, 0-31 |
| HH, H | Hours 00-23, 0-23 |
| hh, h | Hours 00-12, 0-12 |
| mm, m | Minutes 00-59, 0-59 |
| ss, s | Seconds 00-59, 0-59 |
| S, SS, SSS | Milliseconds 0-999 |
| a, A | am/pm, AM/PM |
| DDD, DDDD | Day of year 1-365 |
| ddd, dddd | Day of week Mon, Monday |
| e, E | Day of week 0-6, 1-7 |
| WW, W | Week of year 01-53, 1-53 |
| x, X | Timestamp 1410715640579, 1410715640.579 |
| Z, ZZ | Offset from UTC +12:00 |
With the date and time attribute data type properly set, after clicking into a cell, a date picker will appear. When you select a date, it is automatically saved in the correct format.
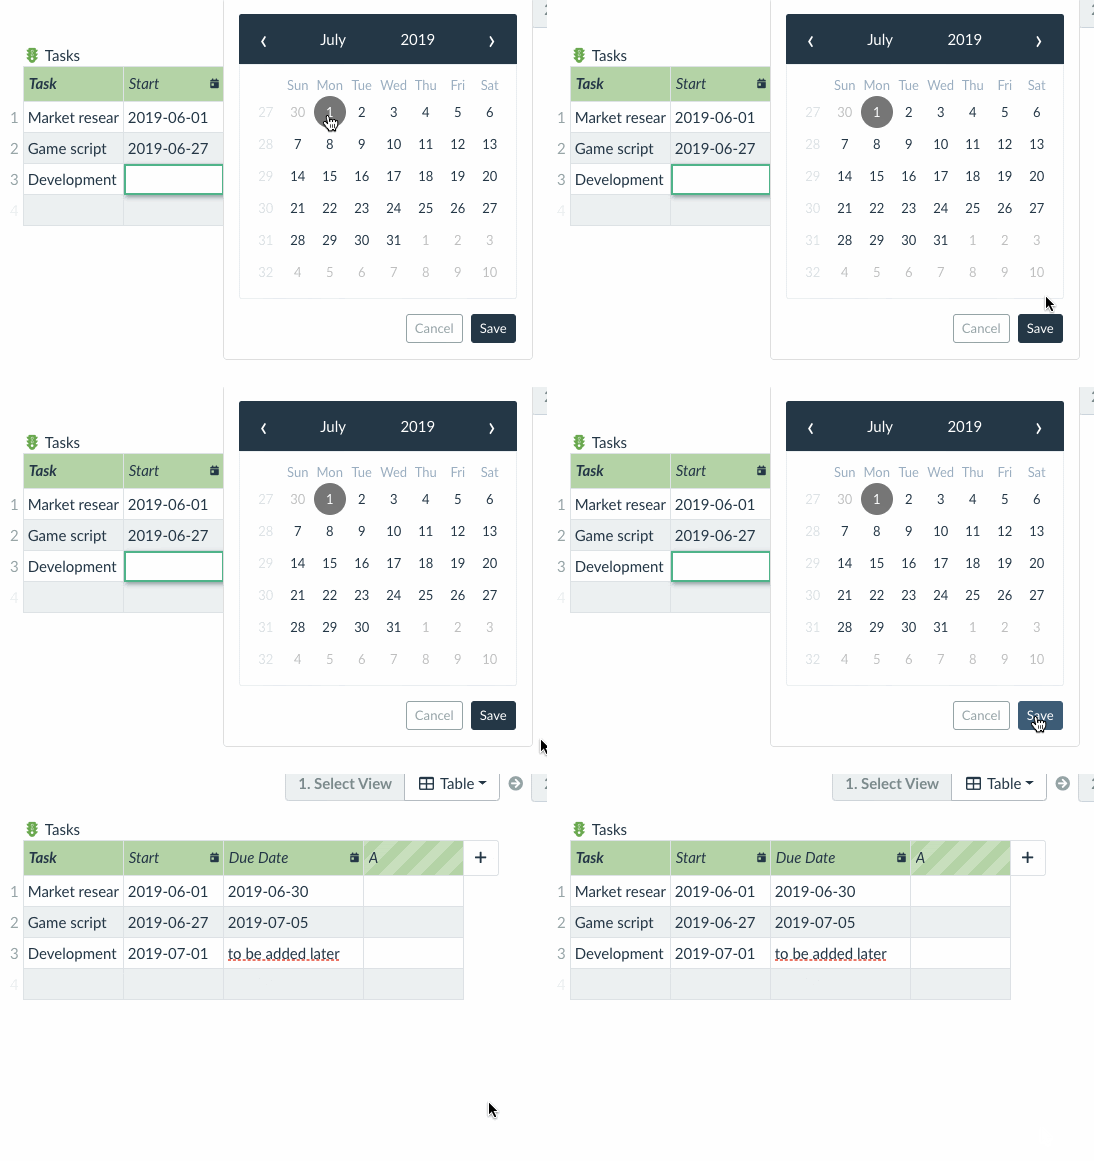
Attributes of type Date are useful in multiple views. You can use them in e.g. in calendar, timeline or pivot view.
Storing Date and Time in UTC
There is an option to always store date and time in UTC. Normally, a stored date and time also stores your current time zone. If you travel and change your time zone and open Lumeer again, you will see the date and time shifted accordingly.
This is useful for storing start and end times of an event like a meeting – everyone in the team will automatically see the correct meeting beginning, no matter where they are on the globe.
However, sometimes, we do not want this to be the case. For example when we store a payroll period start date. It always starts at the same date, no matter where you are. Or when you report work on a project. It is invoiced once the month (or day) is over everywhere on the planet.
Example of Using Date and Time
Consider this table which we use to store information about tasks. It contains a summary of the task, start date and due date. We add the first row – you can of course enter dates without attribute type set and Lumeer will treat them as a text.

Then more people start to collaborate on the table and add new records. If they are guest users, they don’t even see other records (and their date formats) and this can easily result in a situation similar to this:
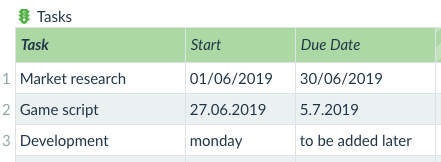
Obviously, such a situation is not desired and we want to prevent it from happening. Date attribute type does exactly that – you can set the format and also set minimum or maximum value if you wish.
Invalid values in the third row are now underlined – that way you or your colleagues will easily spot them and fix them.
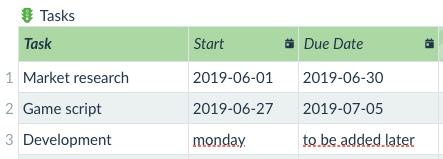
Additionally, when you click a cell, the calendar appears. When you select a date in it, it is automatically saved in the correct format.
So far, we have only looked at the date in the table. But Lumeer offers views that make working with dates much easier and more efficient.
We will add a few more rows to the table. We use the Tasks table from the project management template.

Changing the view to the timelines (Gantt chart) will give us a clearer oversight of the tasks. In addition, we can set dependencies between tasks.

The timeline is useful for displaying records that have a start and end date and last longer.
But consider the following table from the candidate coordination template.

The records in it have an exact start time and, conversely, they do not have any end at all. In addition, we plan in a much shorter time horizon (a few days).
For such cases, it is more beneficial to use a the calendar view.

In the calendar, you can easily move an event by drag of a mouse, open a detail by double-clicking on a record, or drag in an empty space to create a new event.
Actions
The Action attribute data type lets you add action button in your data.

These buttons then execute automations and can manipulate individual records. This is useful to have a better control over allowed task states or to move processes between states.

In the Action attribute data type settings, you can select the automation that is executed when a user clicks on the action button.
You can also specify conditions needed for the button to be enabled. First, a required role (in the example image above, a user needs to have write access to the given record/row). Second, various conditions on attribute (column) values.
To make it clear to regular users what conditions need to be met, a disabled button has a tooltip showing the missing conditions.

The button design is fully customizable. You can change the title, color, and icon. Either an icon, a label or both need to be present. This means, that either an icon or a label can be omitted.
The last configuration parameter specifies a confirmation dialog. This can prevent an accidental click on the button. When turned on, a user is first presented with the specified question and they need to confirm the button click.
Users
The User attribute data type lets you set email address and team name as a value in the table.

When setting the type, you can choose whether you allow only registered users (who belong to the organization) or any valid email address.
You can also specify whether you allow just users, teams, or both of them.
If the address belongs to an existing user and they registered with a name (e.g. they are signing in via their Google account and have a name set up there), then their name will be displayed if the “Display user name instead of email” option is turned on. Otherwise, their email address will be displayed.

Selection
The Selection attribute data type lets you choose the value from a pre-defined list. This is useful for task or process states, or states of various work items like invoice payment status, issue being processed etc.
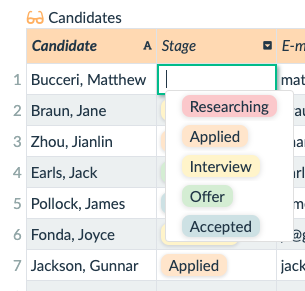
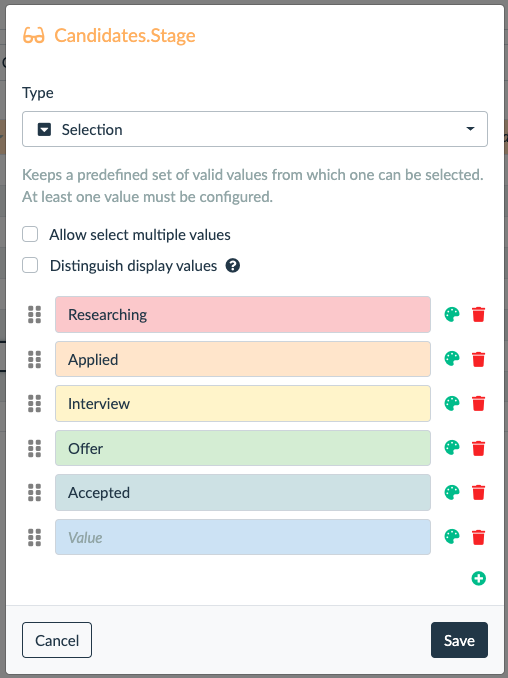
When setting the type to Selection, you define which values will be allowed.
Every value gets a different colour by default. You can change the colours by clicking on the palette icon.
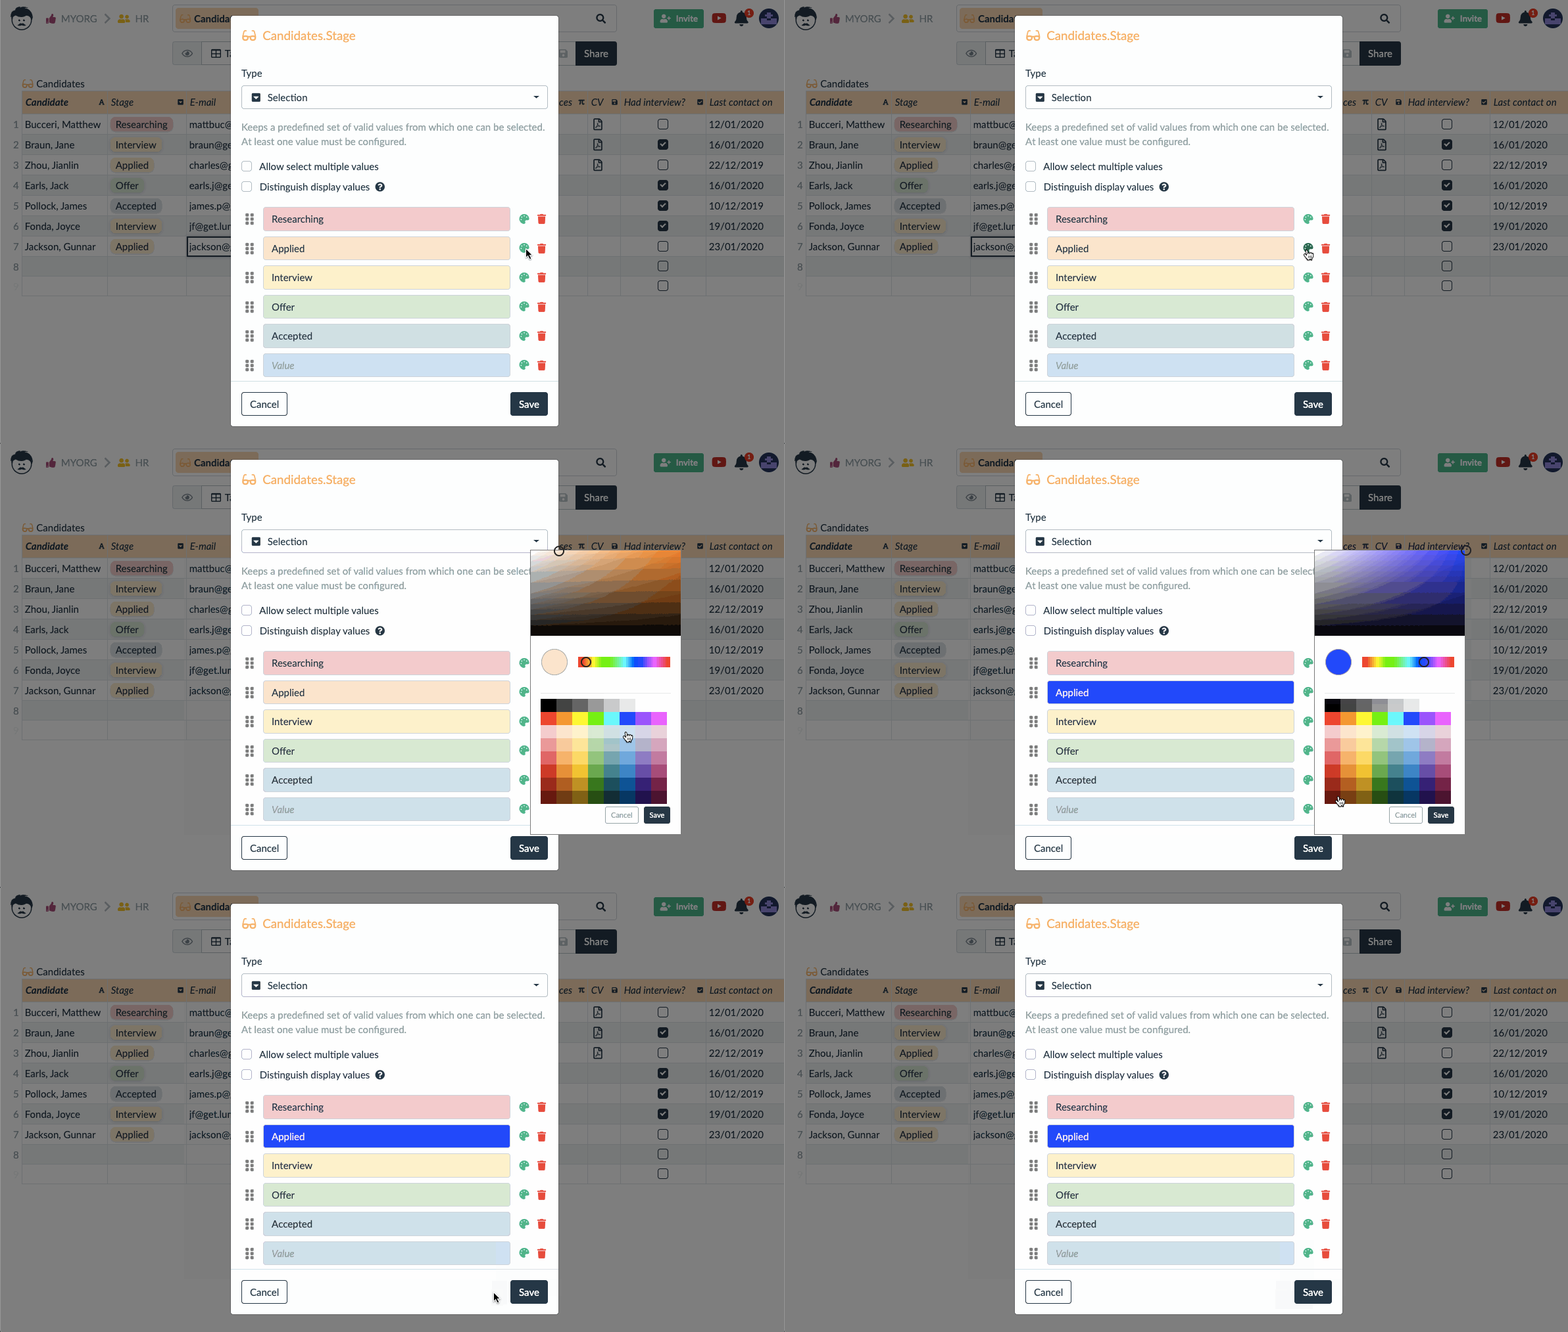
You can also reorder the items by dragging the reorder icon on the left.
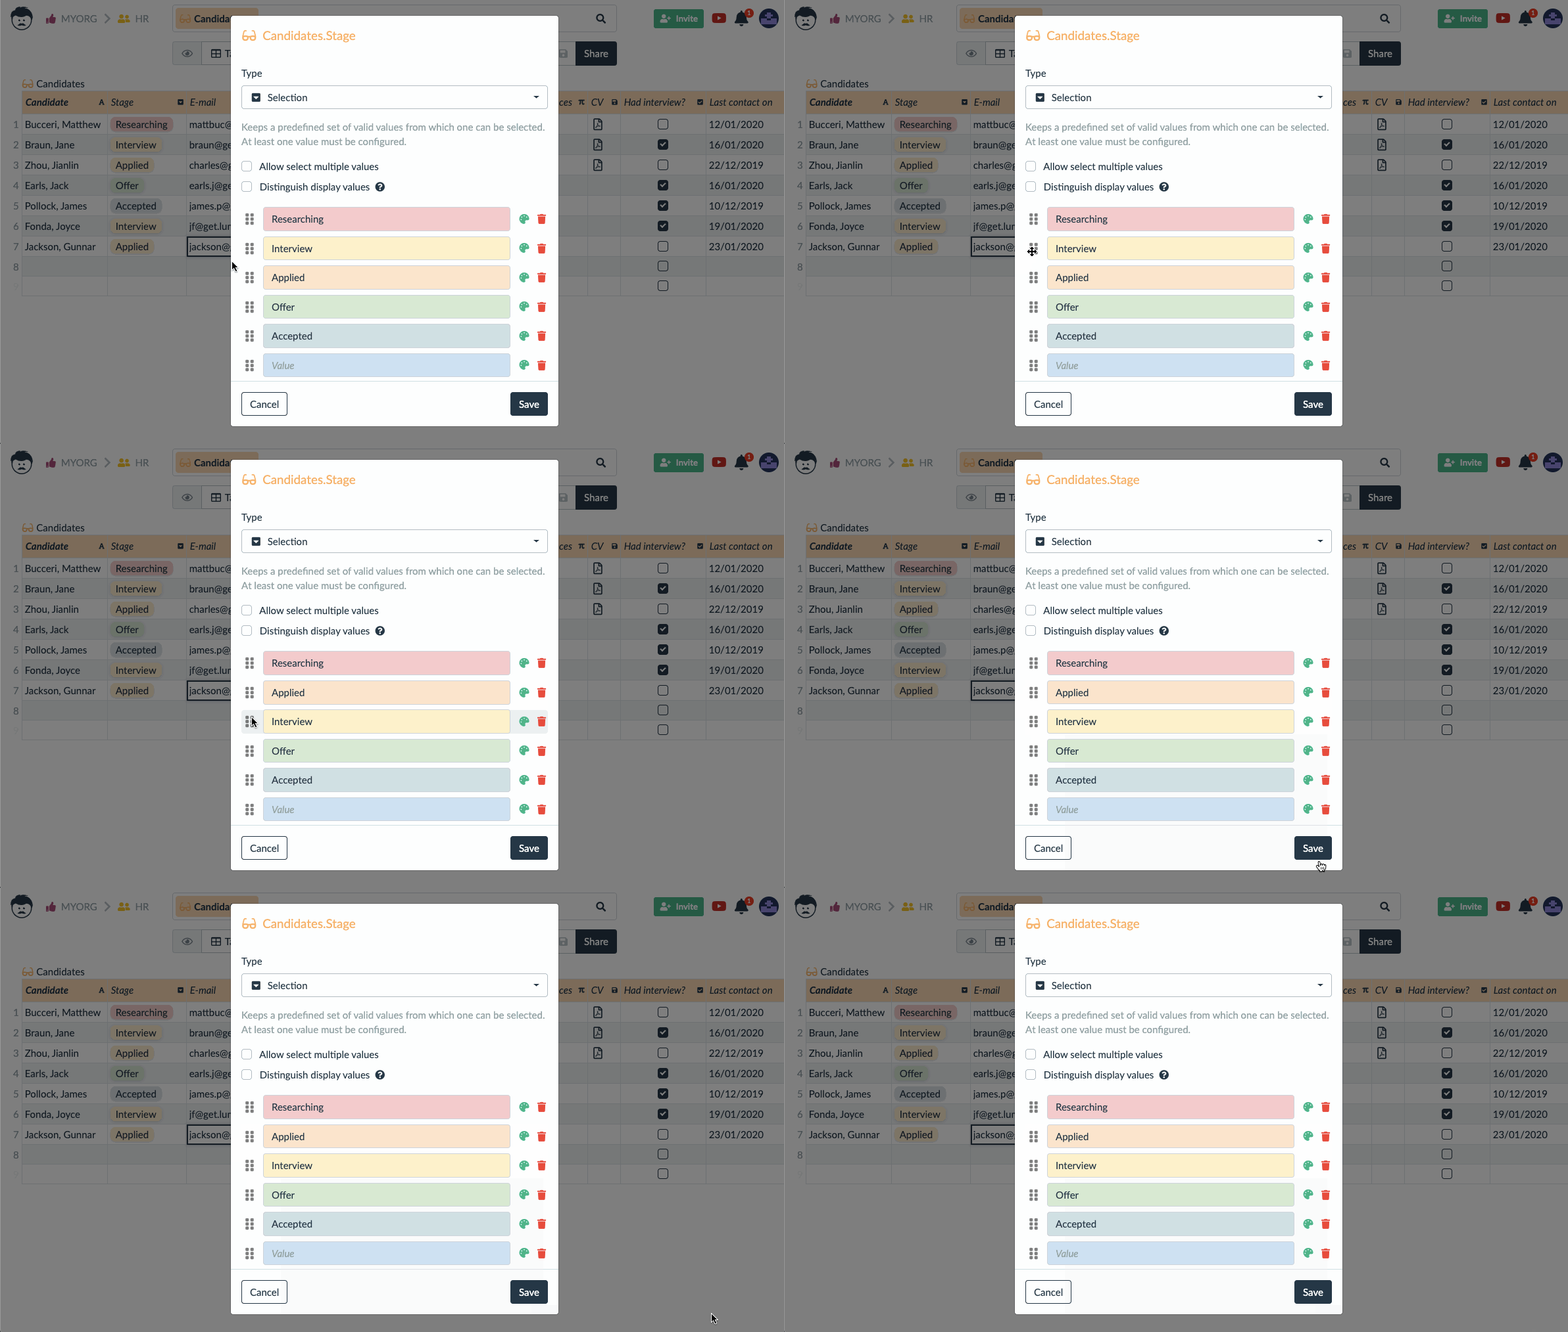
The order of values is then respected in various views, when records are ordered according to the selection column (attribute). It is especially useful to have task or process states listed in a logical order as they normally follow each other.
The values can be shared between multiple tables using shared Selection Lists.
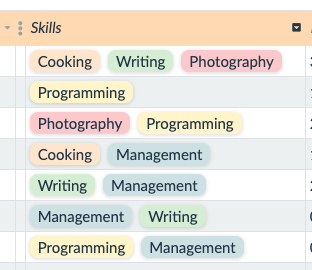
Sometimes it makes sense to allow selection of multiple values. They are then displayed as tags in the table.
It is possible to keep different displayed values and different values that are actually stored in records. This can be useful when importing data where states are represented as numbers for instance.
Automations and functions work with stored values. If the stored values are numbers, there might be easier to process in automations.
Checkbox
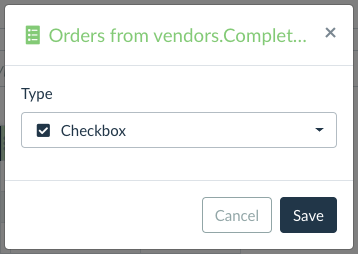
The Checkbox attribute data type represents boolean (true/false) value in a visual way that is easily distinguishable at first sight.

Just set the type to checkbox.
Duration
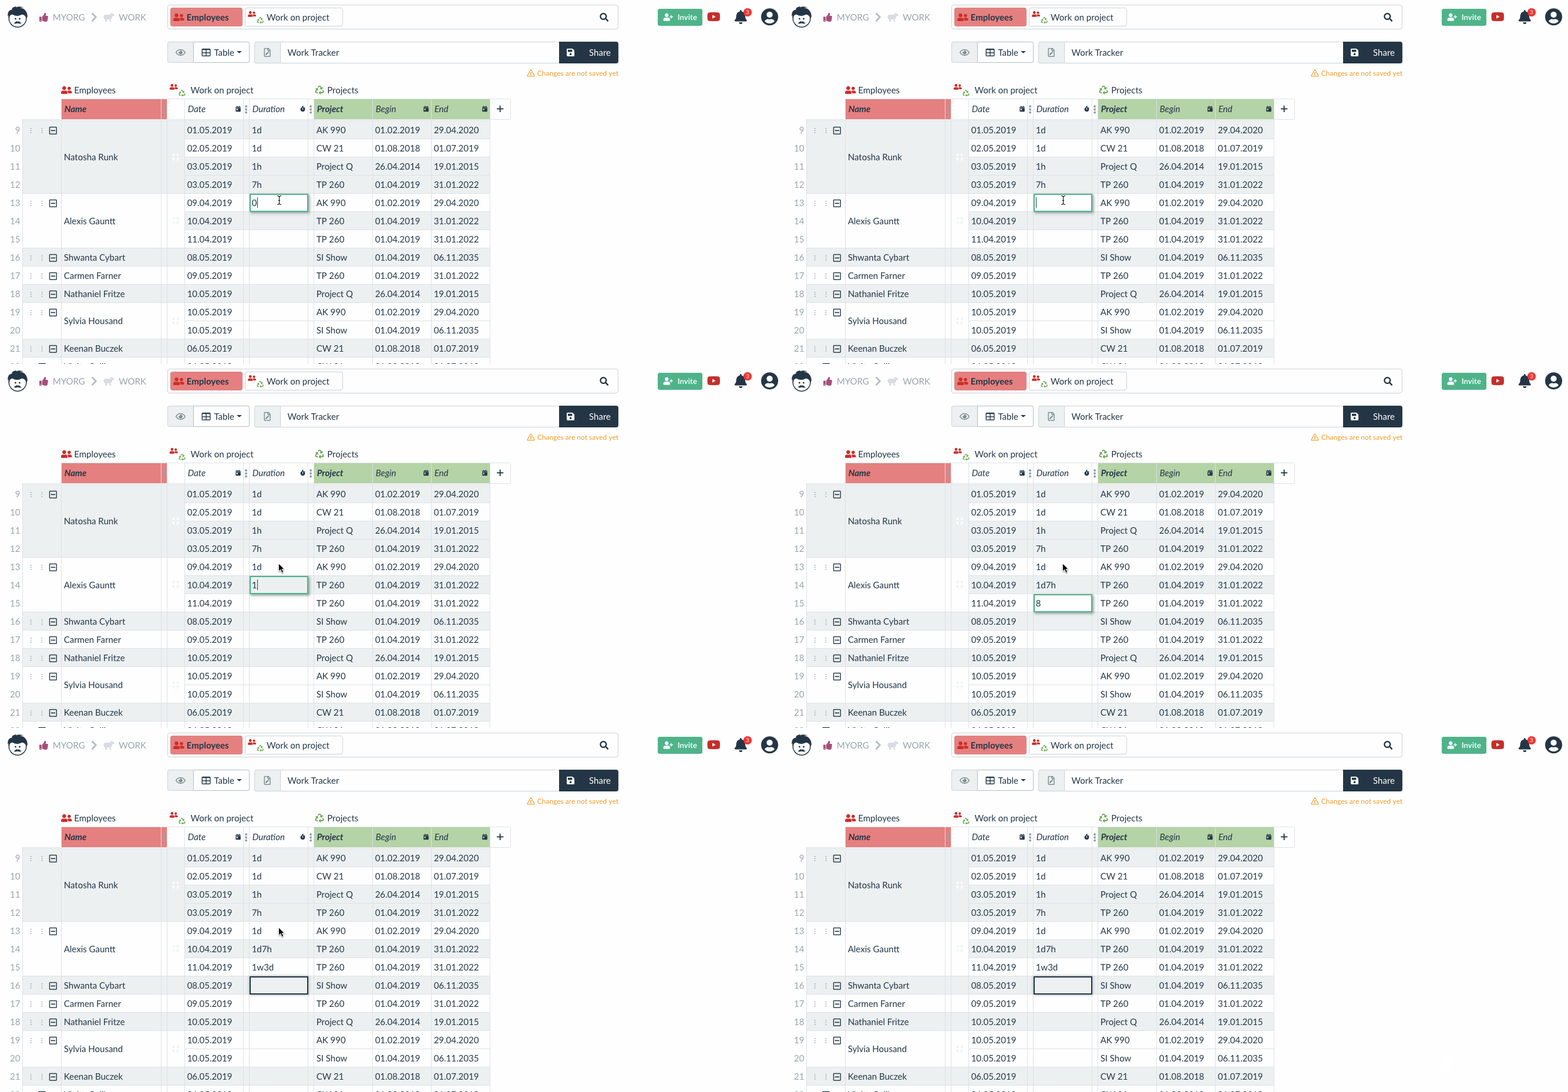
The Duration attribute data type allows you to enter and display time intervals in a human-friendly way.

When you are setting the type to Duration, you can further configure its behavior by changing time scope.
There are two pre-set configurations:
- Normal – week has 7 days and day has 24 hours
- Work – week has 5 workdays and workday has 8 hours
If you choose Custom configuration, you can set how many days are in a week and how many hours are in a day.

When you enter the duration, Lumeer automatically saves it in an optimal format – e.g. if you enter 25h, it is saved as 3d1h (if time scope is set to Work) or 1d1h (if time scope is set to Normal).
Because Lumeer understands duration values, he can perform aggregations on them in pivot table view.
Text
When there is no attribute type set, you can enter any text as a value, but the Text attribute data type allows you to define additional properties of values.
When setting the type, you can also set case style and minimum and maximum length.
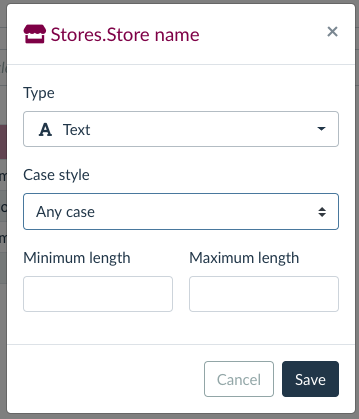
There are five case styles:
- any case (default),
- lower case,
- upper case,
- every first letter upper case,
- first letter of sentence upper case.
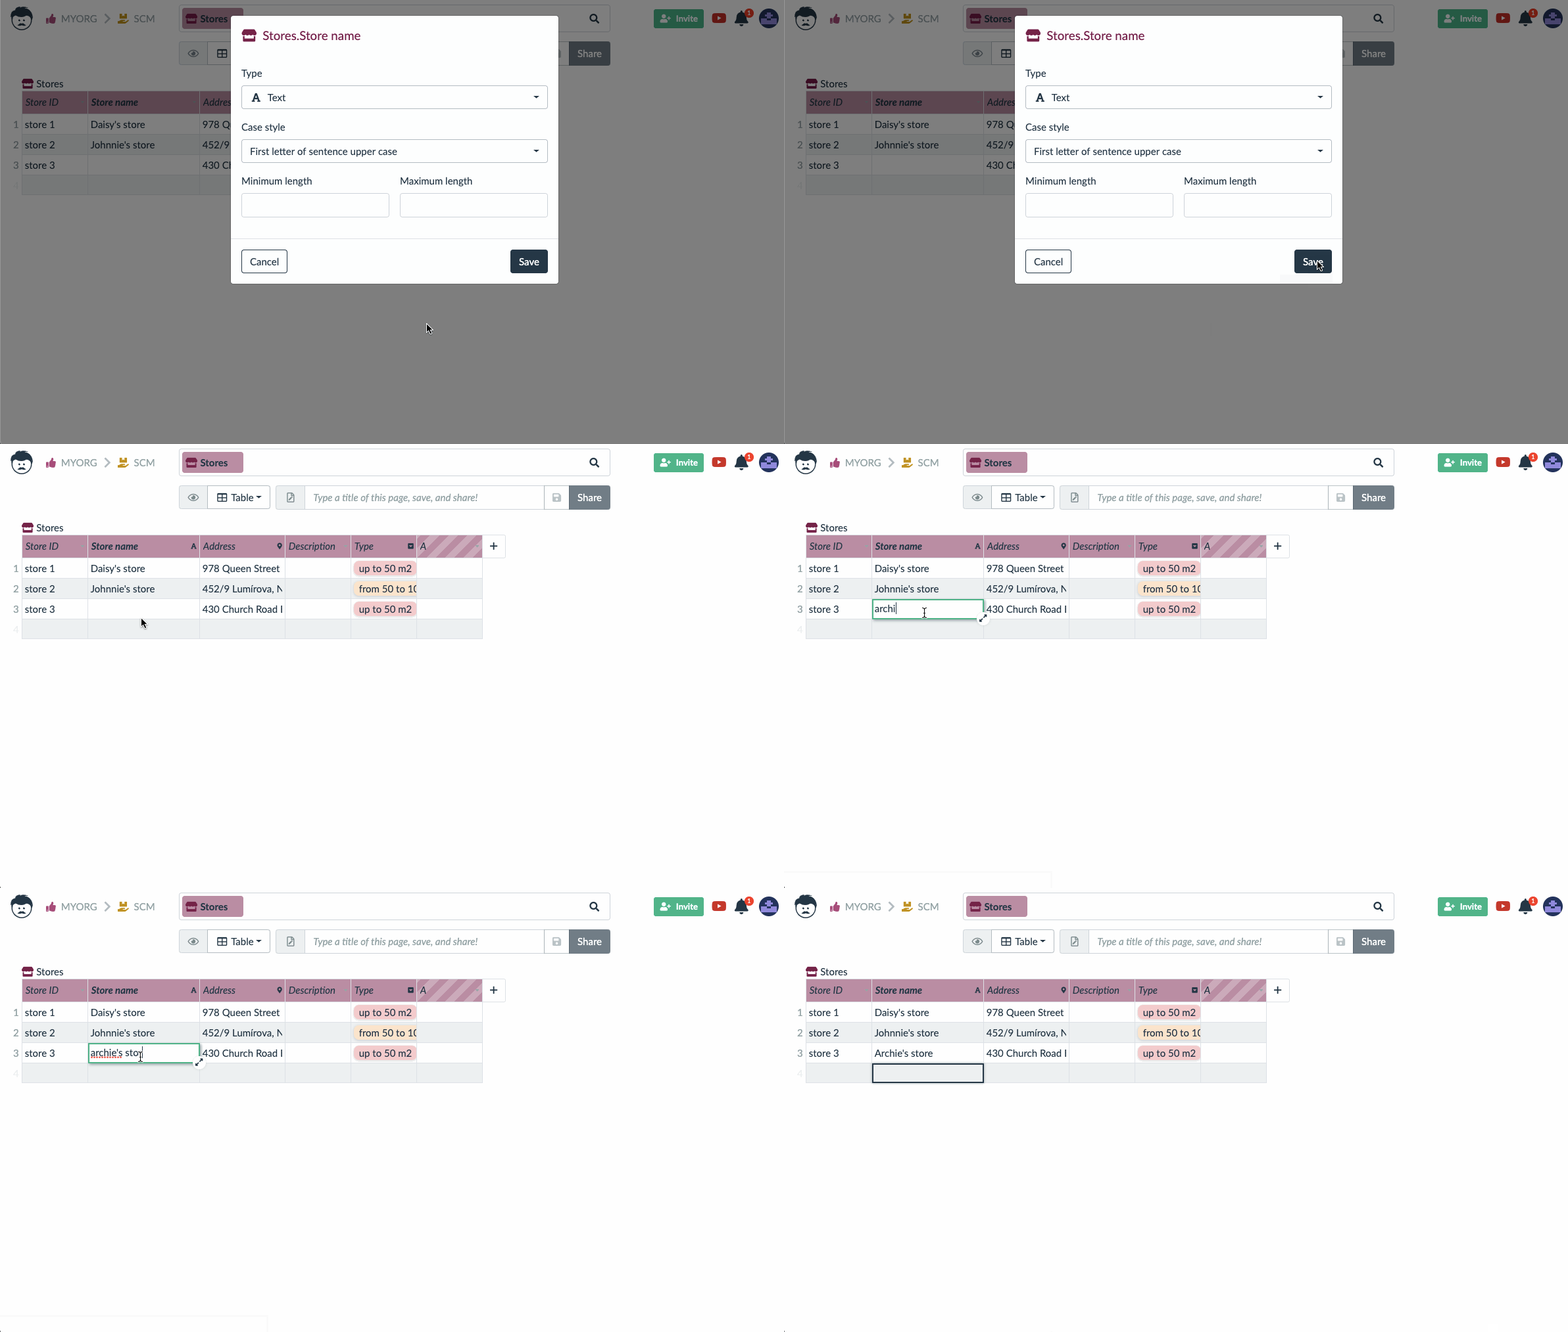
If you enter a text that doesn’t match the style, it is automatically converted.
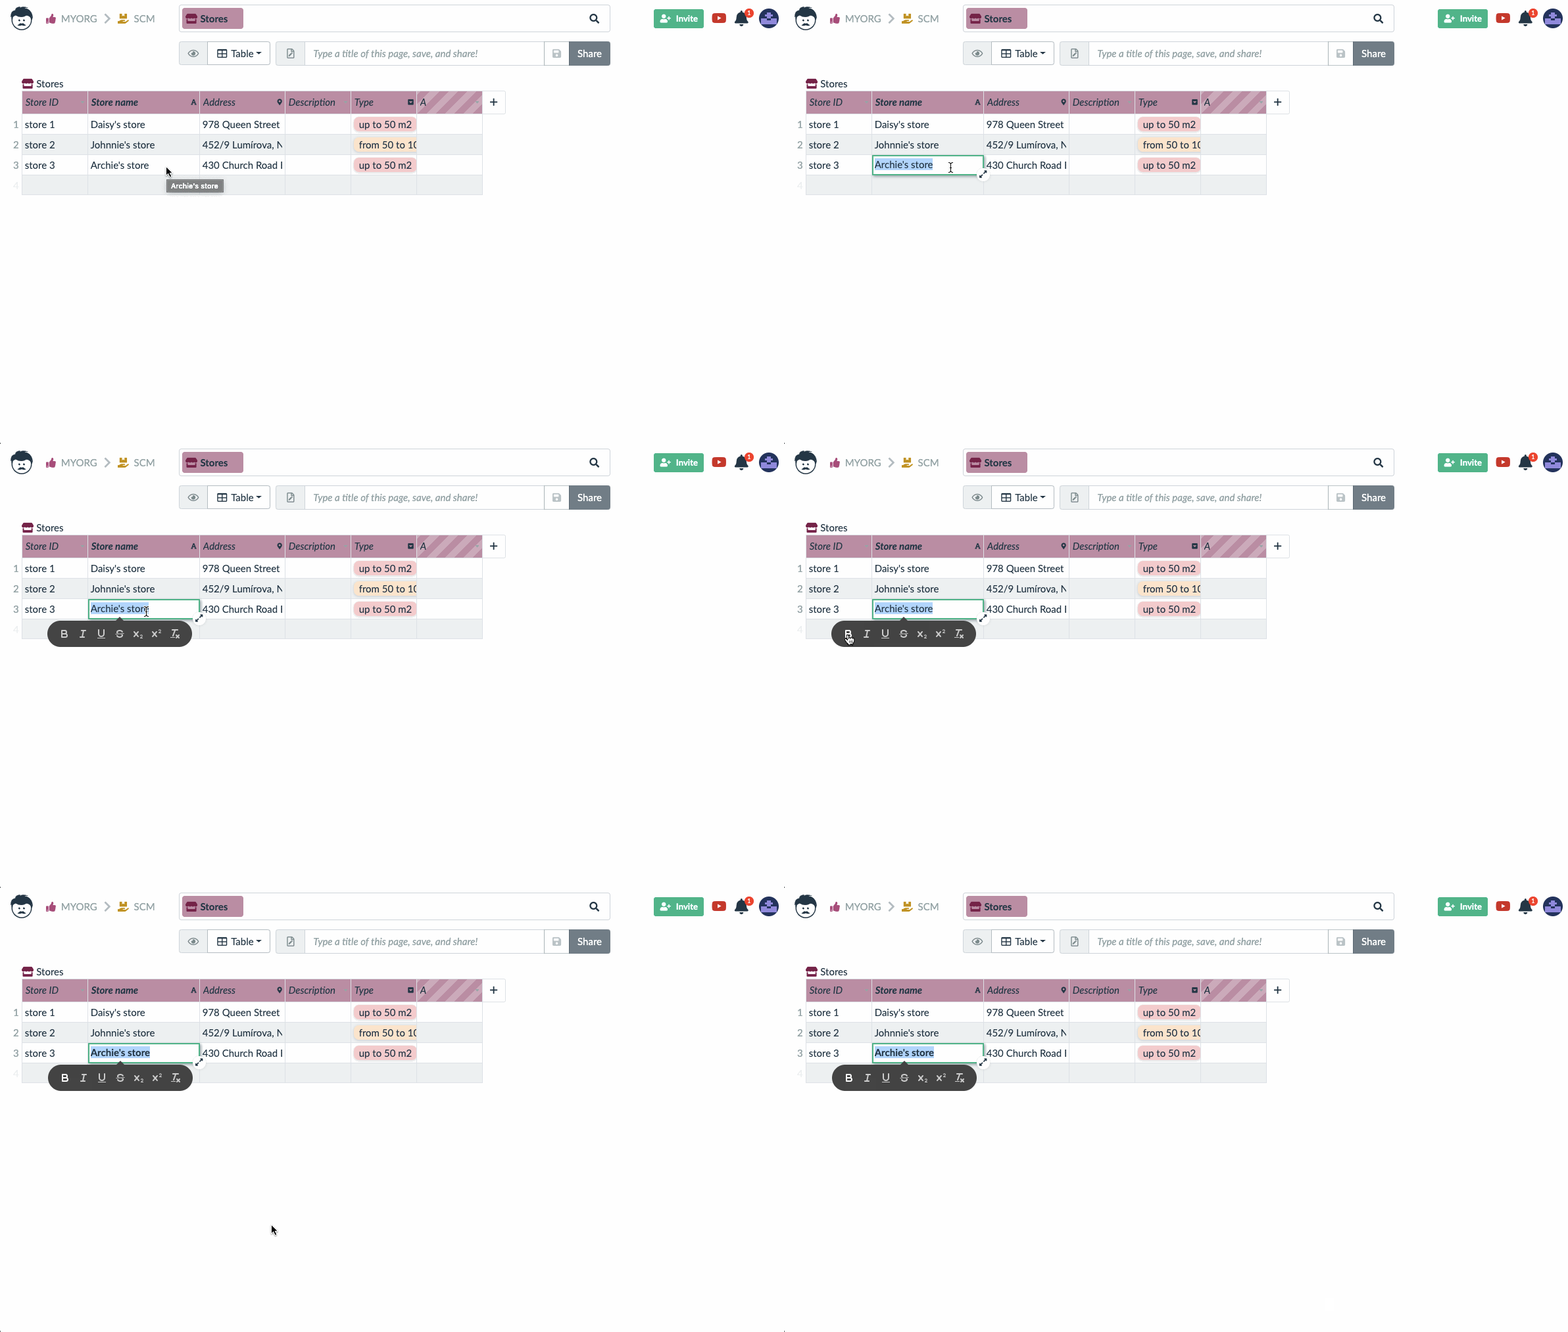
When you highlight the text in a cell, a selection of formatting options is displayed.
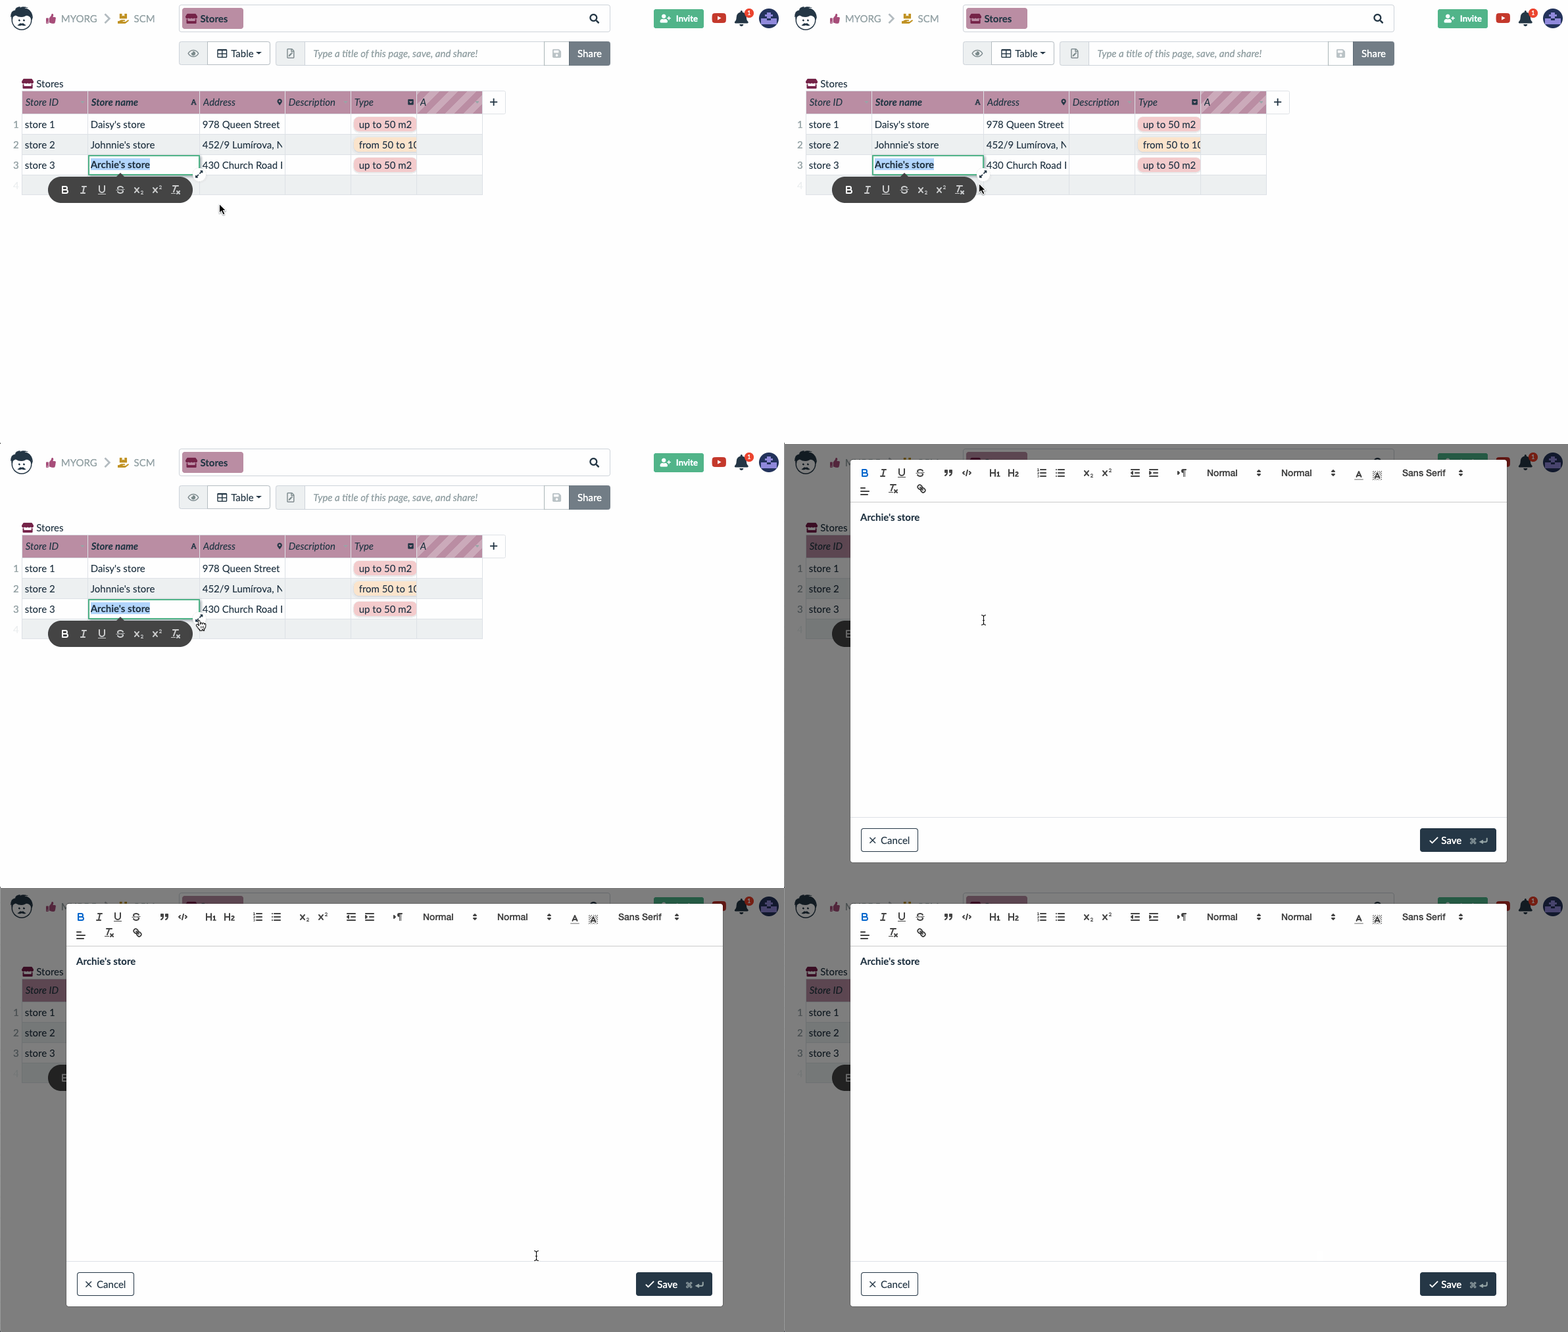
Or you can click on the expand icon and open a popup with rich text editor.
Links
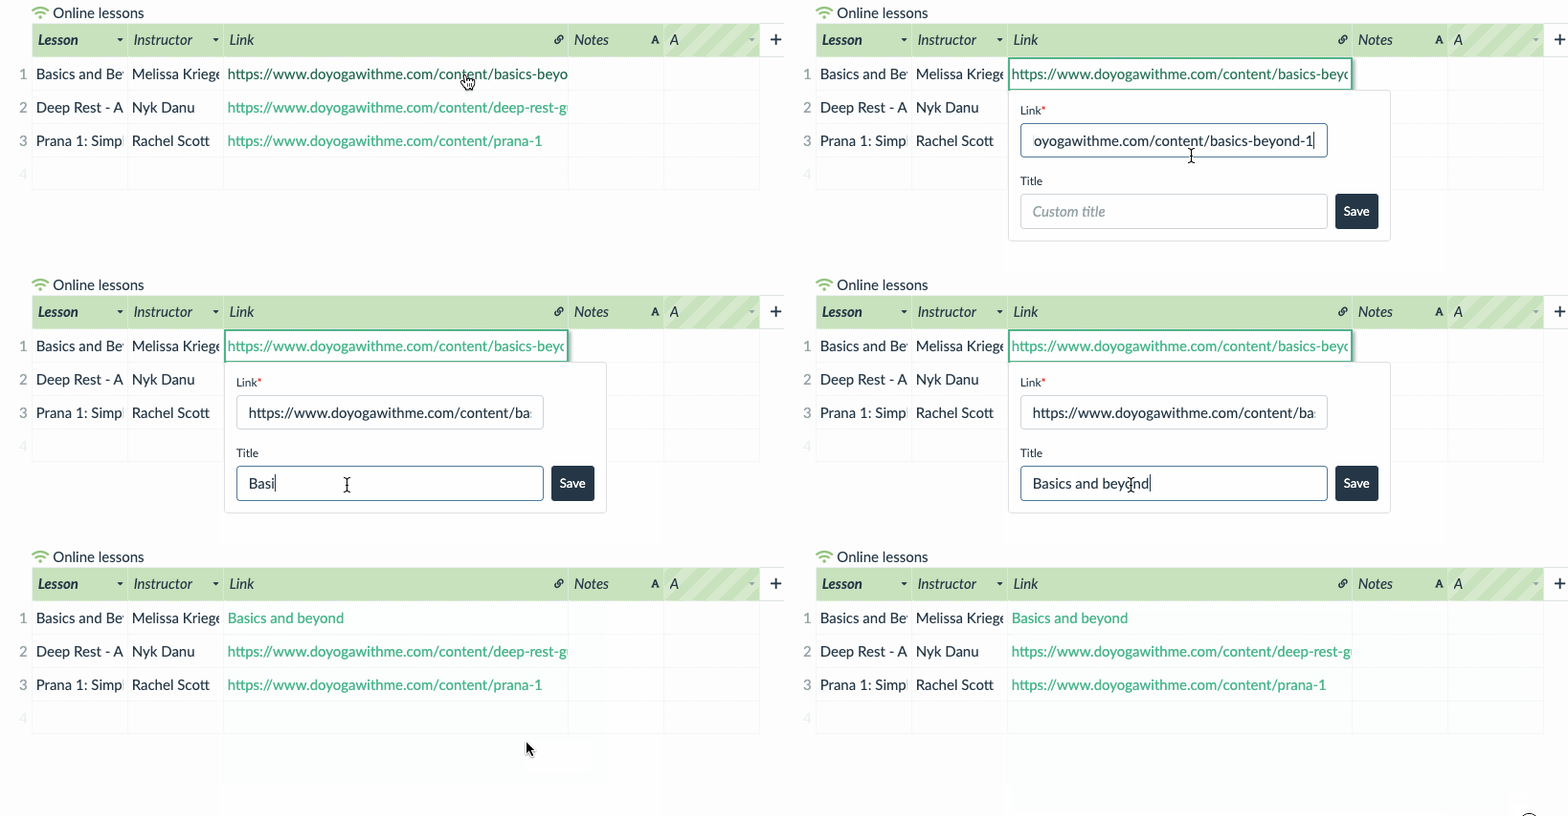
The Link attribute data type interprets the value as a hypertext link. You can then just click on the link to open it, without copying the value.

To enable this feature, just set the type to link.

When editing the value, you can also set the title for the link, which is displayed instead of the raw URL.
Files
Lumeer lets you upload file attachments and save them as attribute (column) values.
After you set the attribute data type to File attachment, double-click on the cell and click on Add file. A standard file upload dialog will appear.

When the file is uploaded, you can see an icon depending on the type of file.

If you click on the icon, the download starts. If you click anywhere in the cell, file name is displayed, and it can be removed by clicking on red trash icon. You can even add more files to the same cell.

Colors
The Color attribute data type enables you to set color as a value in the table.
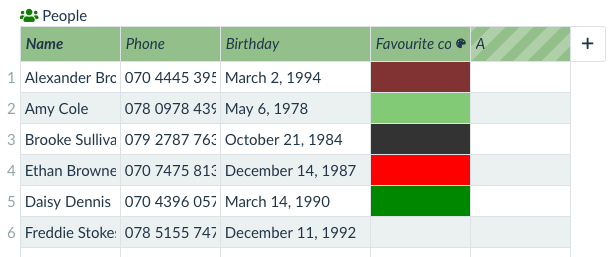
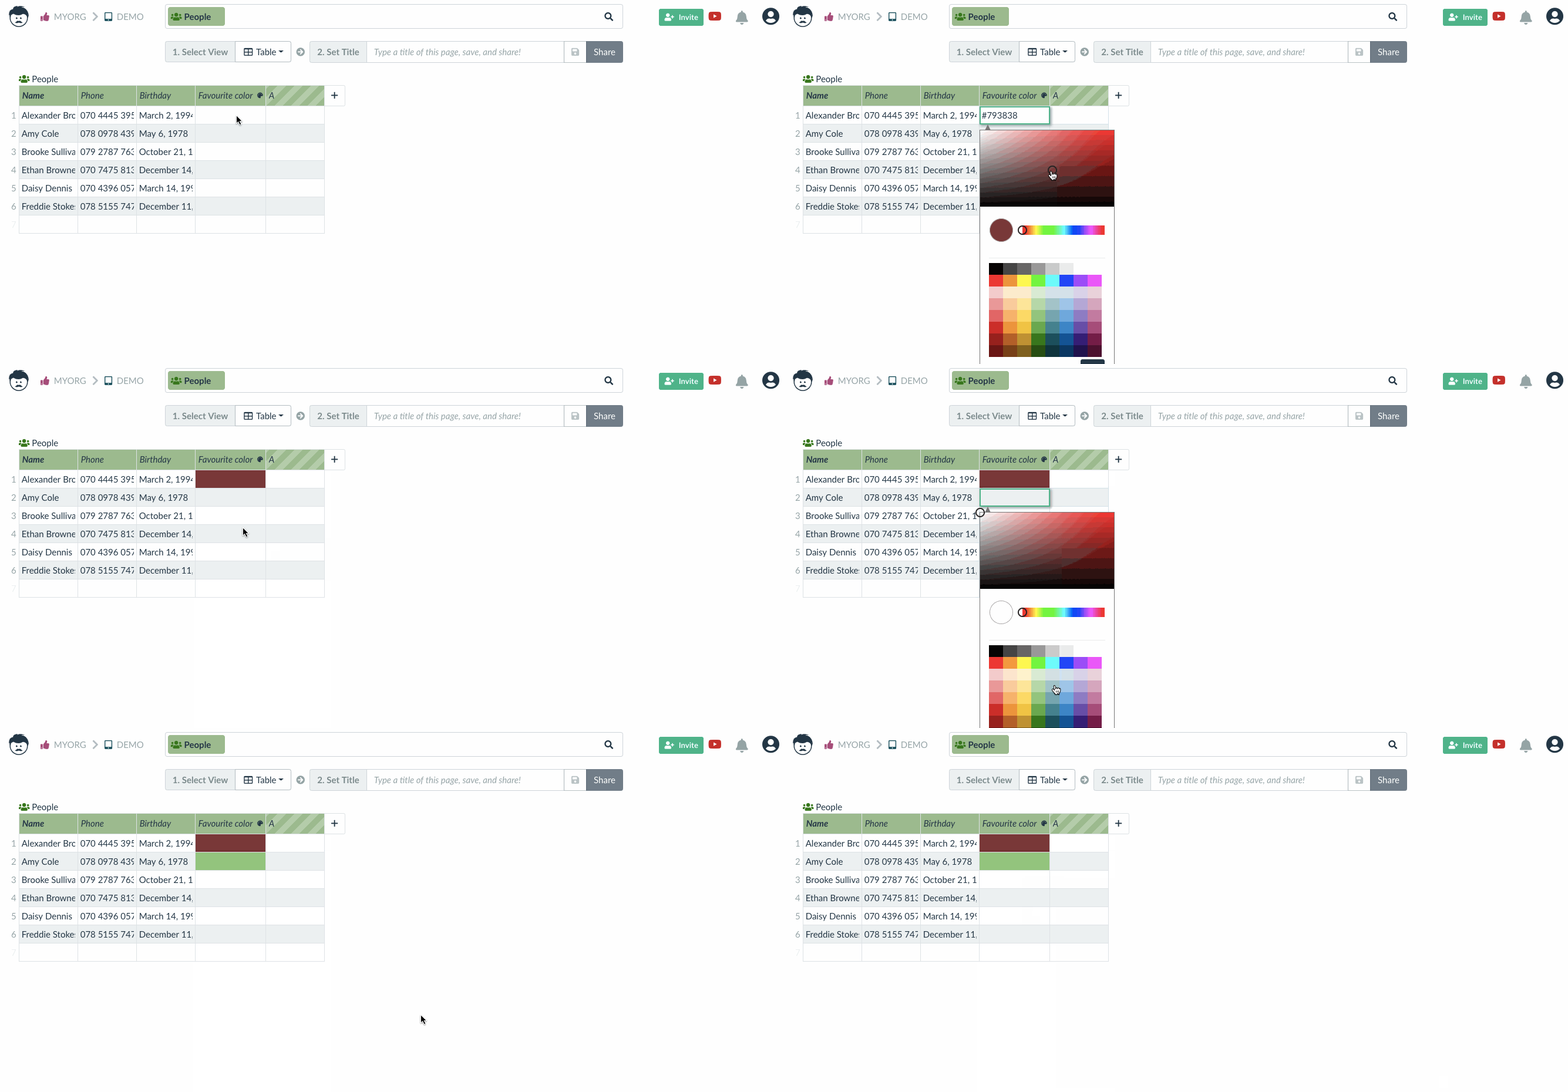
After you set attribute type for the column and click on the cell, you can select the color in the color picker.
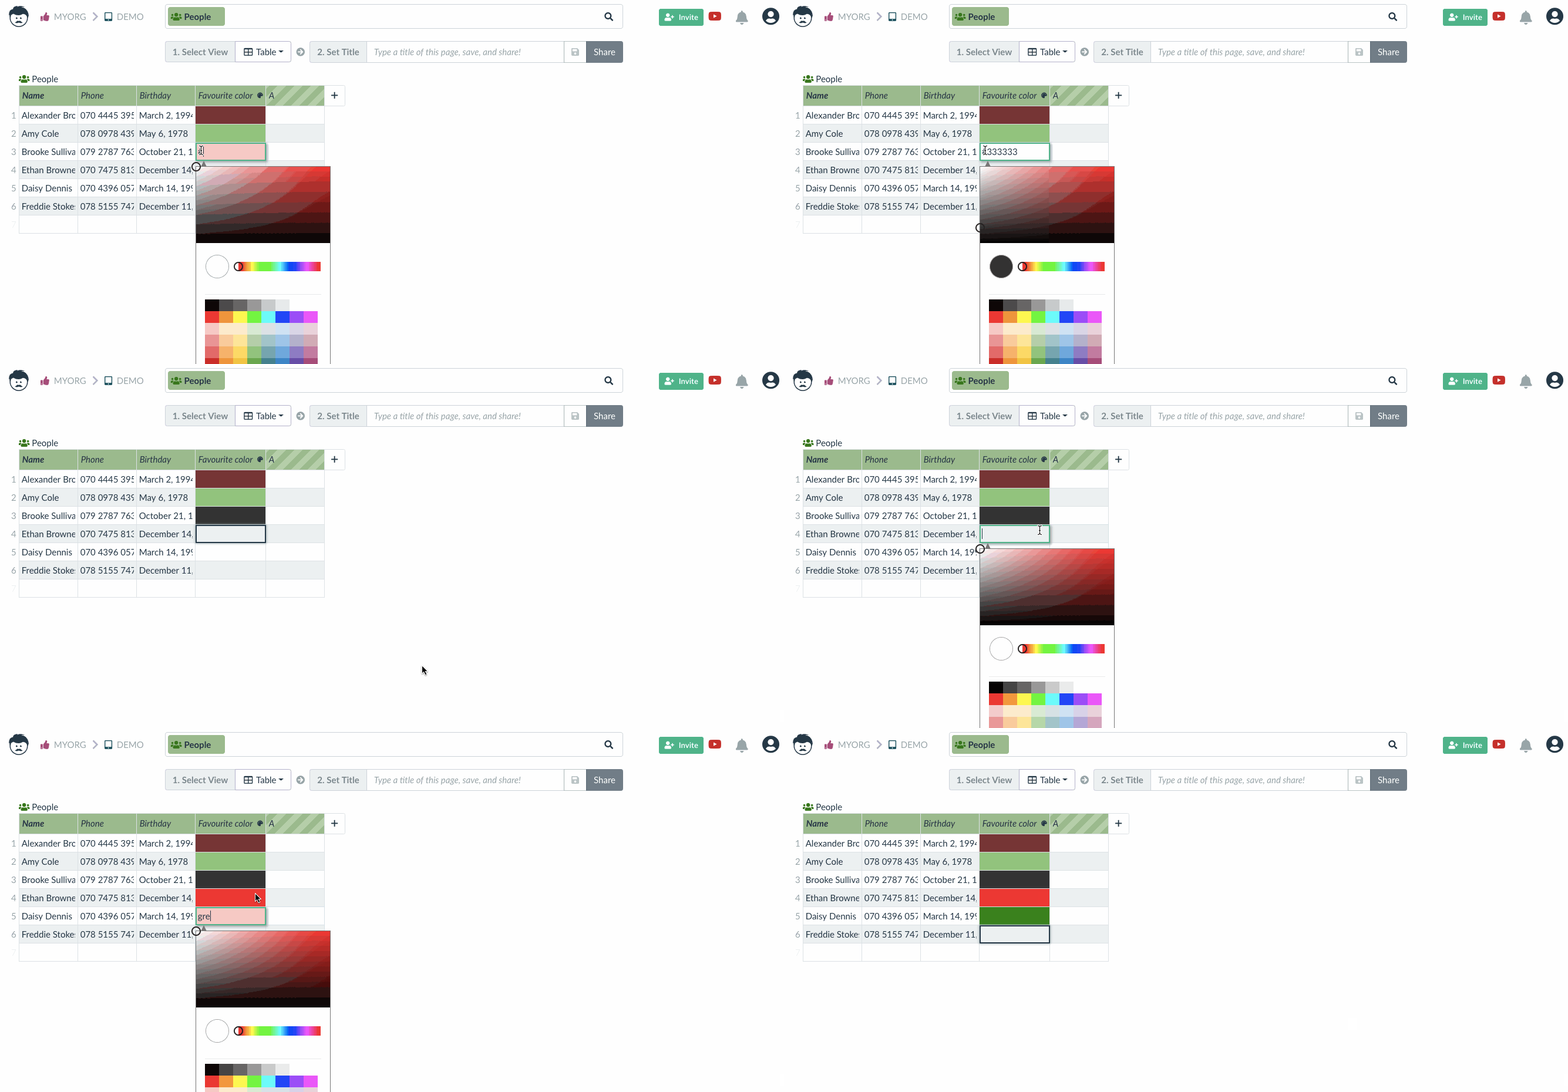
The second way to set the color is to type its name (CSS colors are accepted) or a hexadecimal value.
Addresses
Lumeer lets you save addresses in various formats.

When setting the attribute data type to Address, you can specify the format by dragging-and-dropping the fields. Under the fields, you always see an example. Please note that the order of the active fields is also important. When searching for an address, the input needs to follow the same pattern and order.
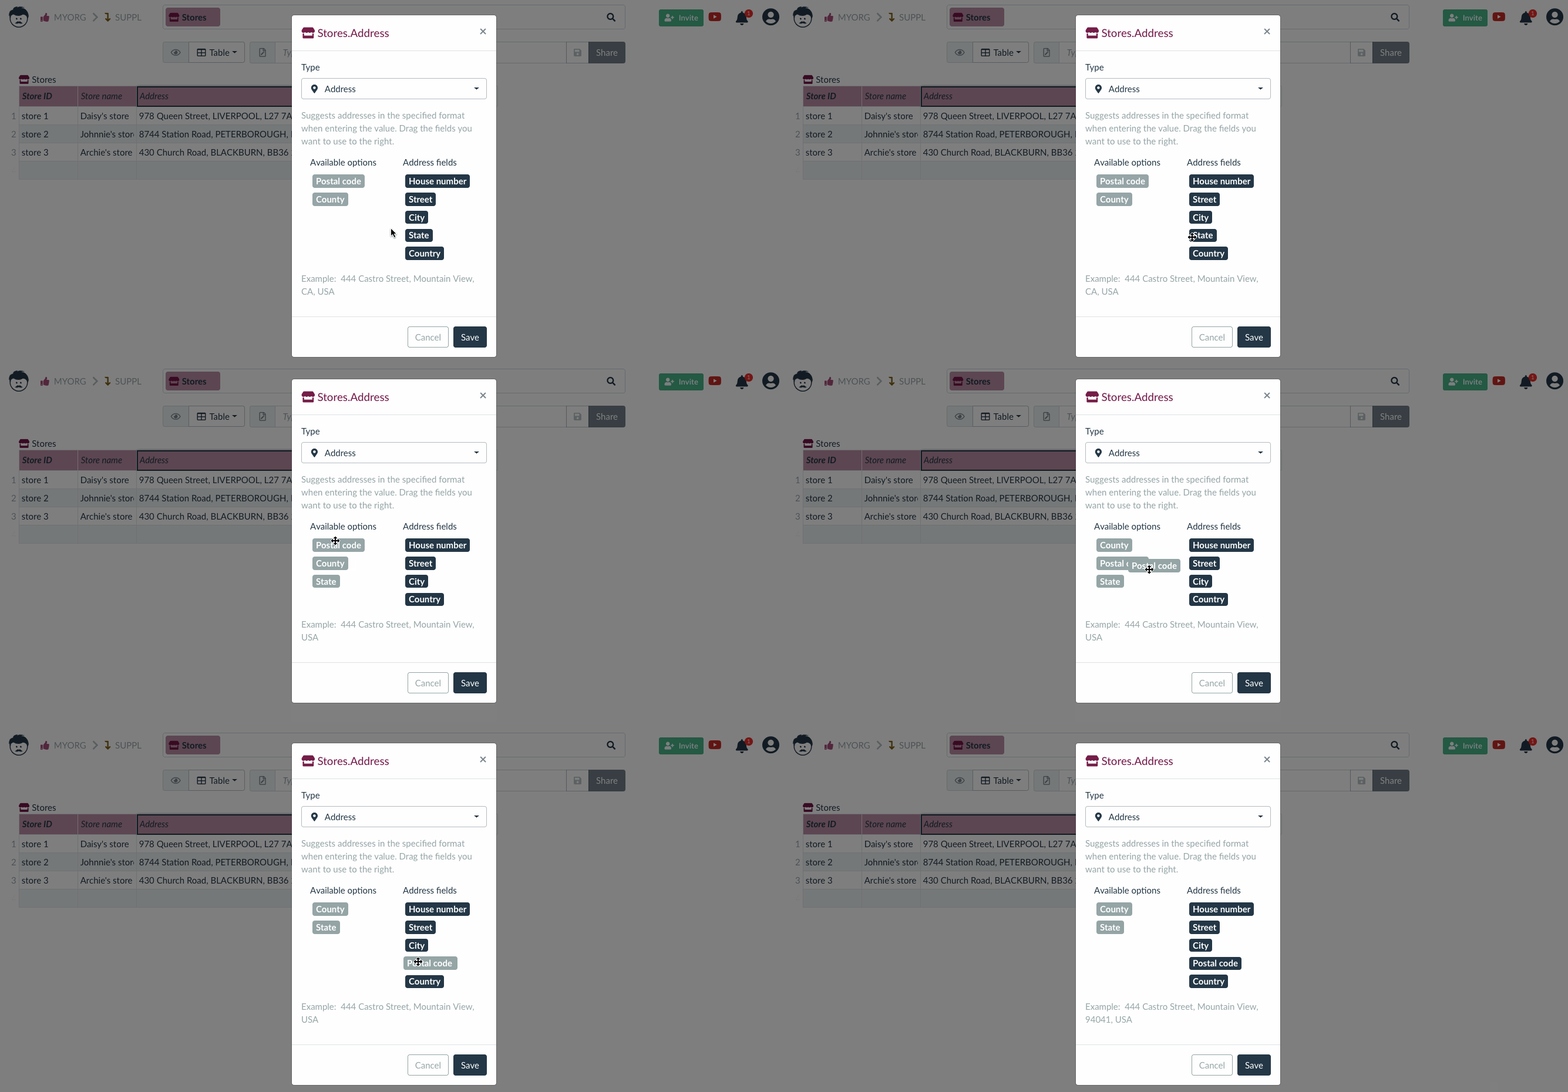
When you start typing an address, Lumeer gives you suggestions in a format you set up.

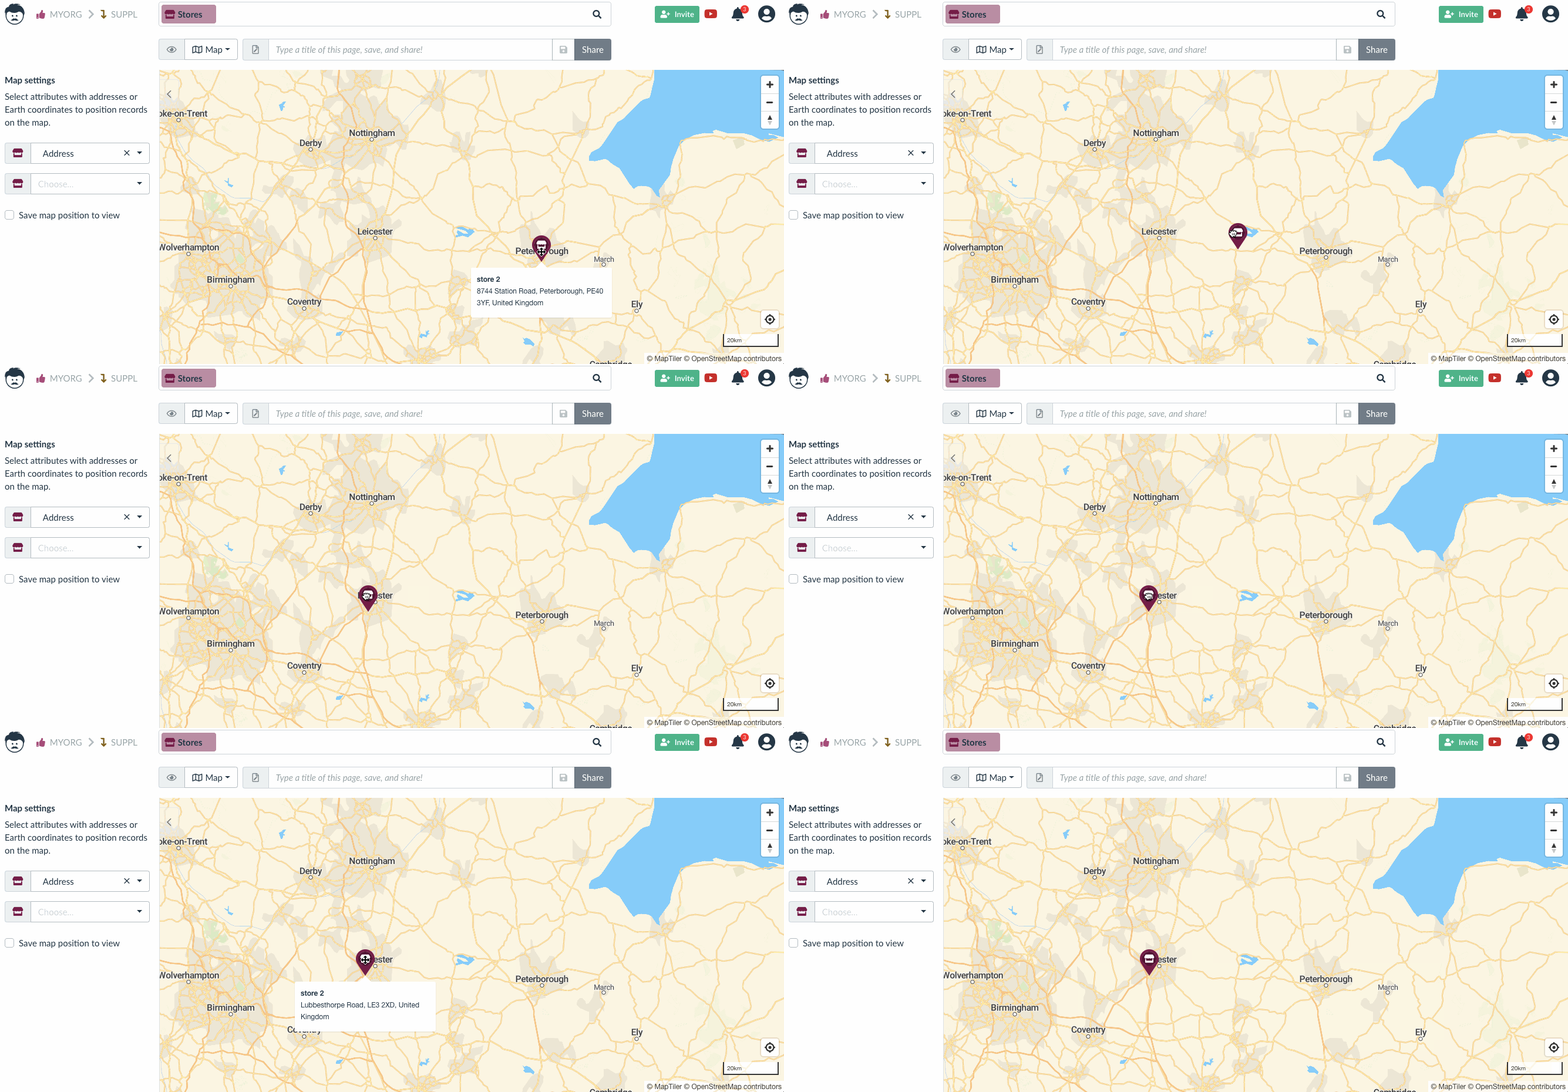
If you change the value of address attribute by moving a pin in the map, the new address is saved in the same format.
Coordinates
The Coordinates attribute data type lets you input geographical coordinates (latitude and longitude).

When setting the type, you can choose between two formats:
- decimal degrees (e.g. 49.233131, 16.570183)
- degress, minutes, seconds (e.g. 49° 13′ 59″ N, 16° 34′ 13″ E).
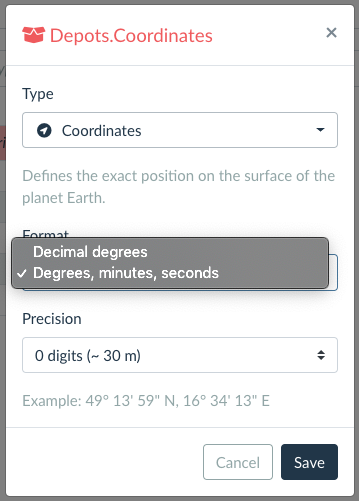
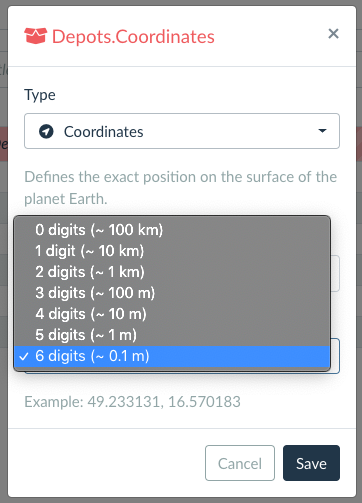
Then you are also able to choose precision (number of decimal digits). The more digits, the more accurate the position.
When you switch the view to map, the attribute of type Coordinate is automatically chosen in the settings and displayed on a map.
Views
The View attribute data type allows you to specify existing views in data values.

This can be useful in tasks when you require some input in a specific view. It is also possible to use automations and provide only a temporary access to the specified view for the duration of the task.

In the configuration, we can require the view to be opened in a new browser tab/window. We can also allow specifying multiple views in a single value (i.e. table cell).
New Data Types Coming
At the moment, we have a list of couple of requests for additional attribute data types. These are constantly being added based on the user demands. If you have an idea or a wish for additional data types, please let us know using the contact form, or feedback functionality in the application.