An Easy Insight on a Team Members Utilisation

You might not only be a business offering contractors to have employees working on multiple projects at the same time.
The important question you often need to answer is what skills do you have available and when for you to commit to the next big project.
It would be great if we could find such an answer easily and quickly. Many companies use spreadsheets or some other workarounds to deal with this, however, it brings only a partial relief.
In Lumeer, we can easily manage all the information and have a single source of truth available to everyone.
Let’s start with tracking our team members and projects.
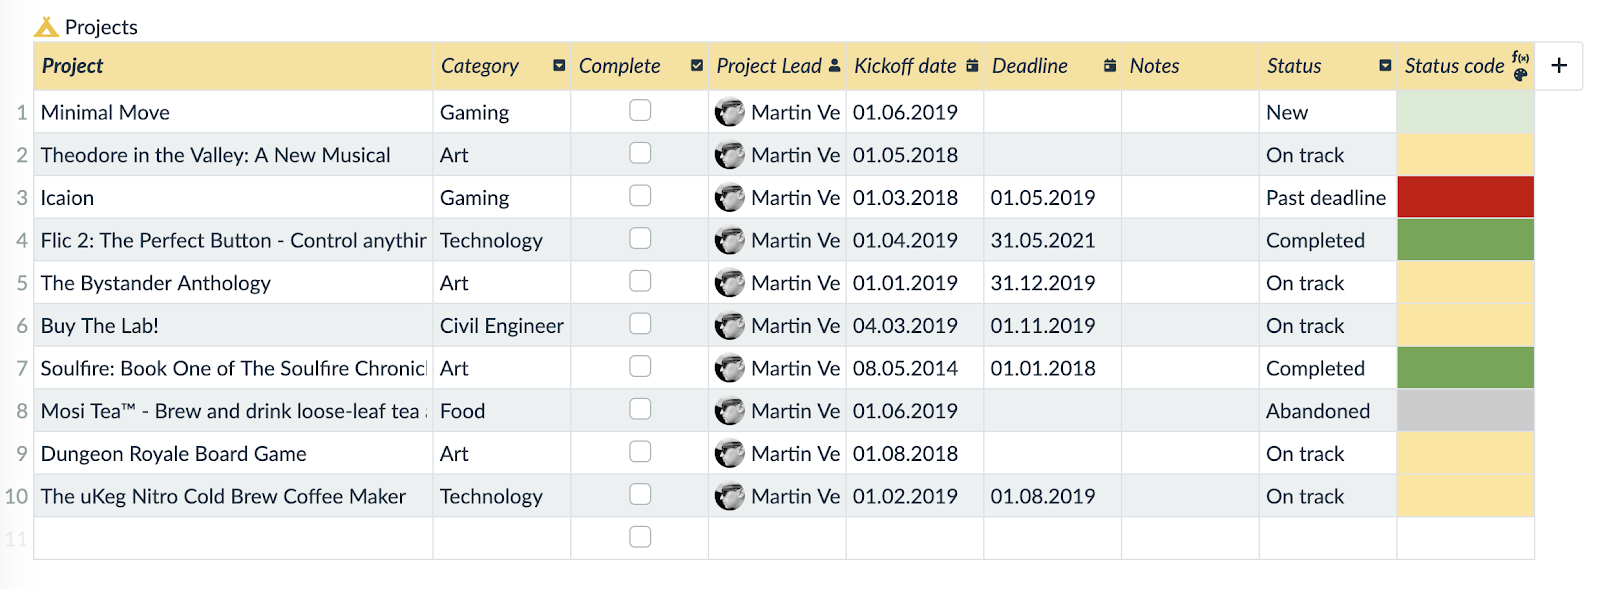
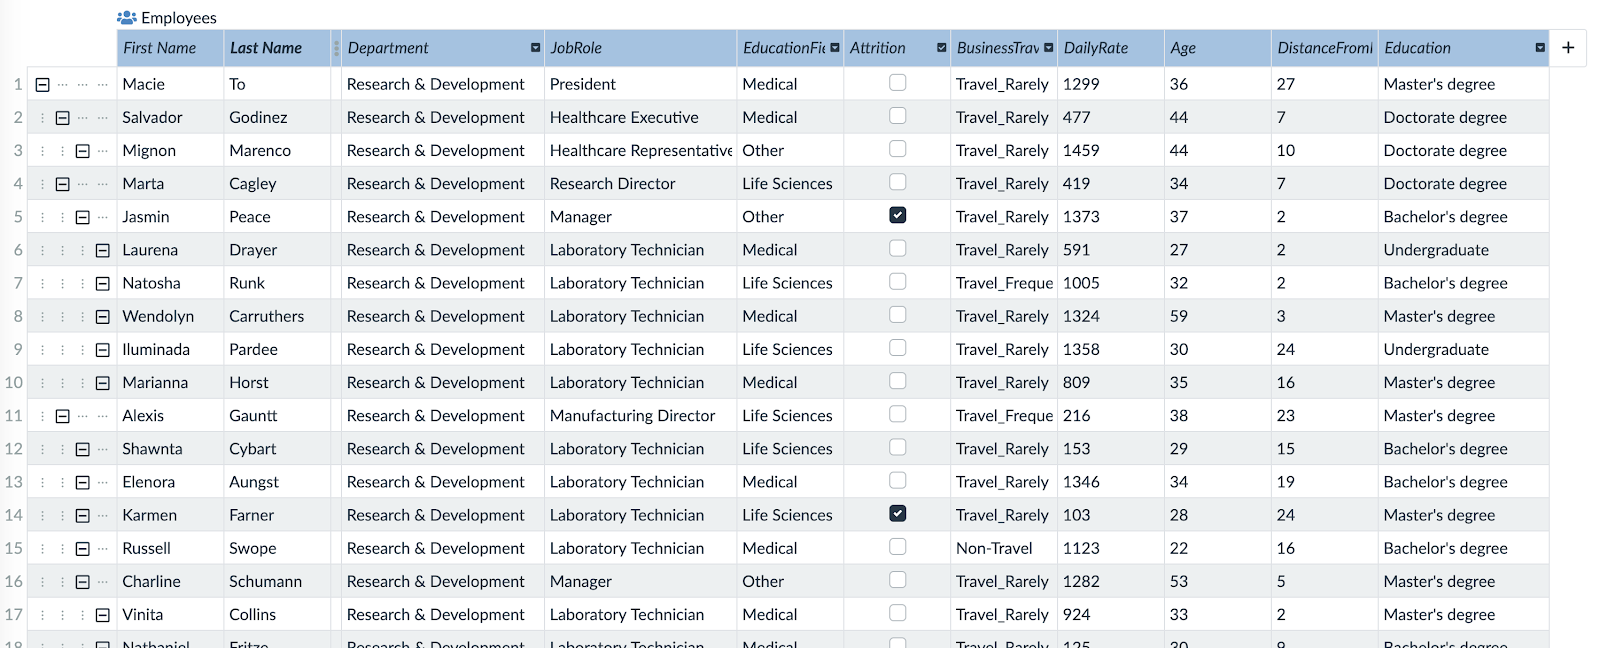
The first unique value of Lumeer is that we can put our data into relations – we can link team members to projects.
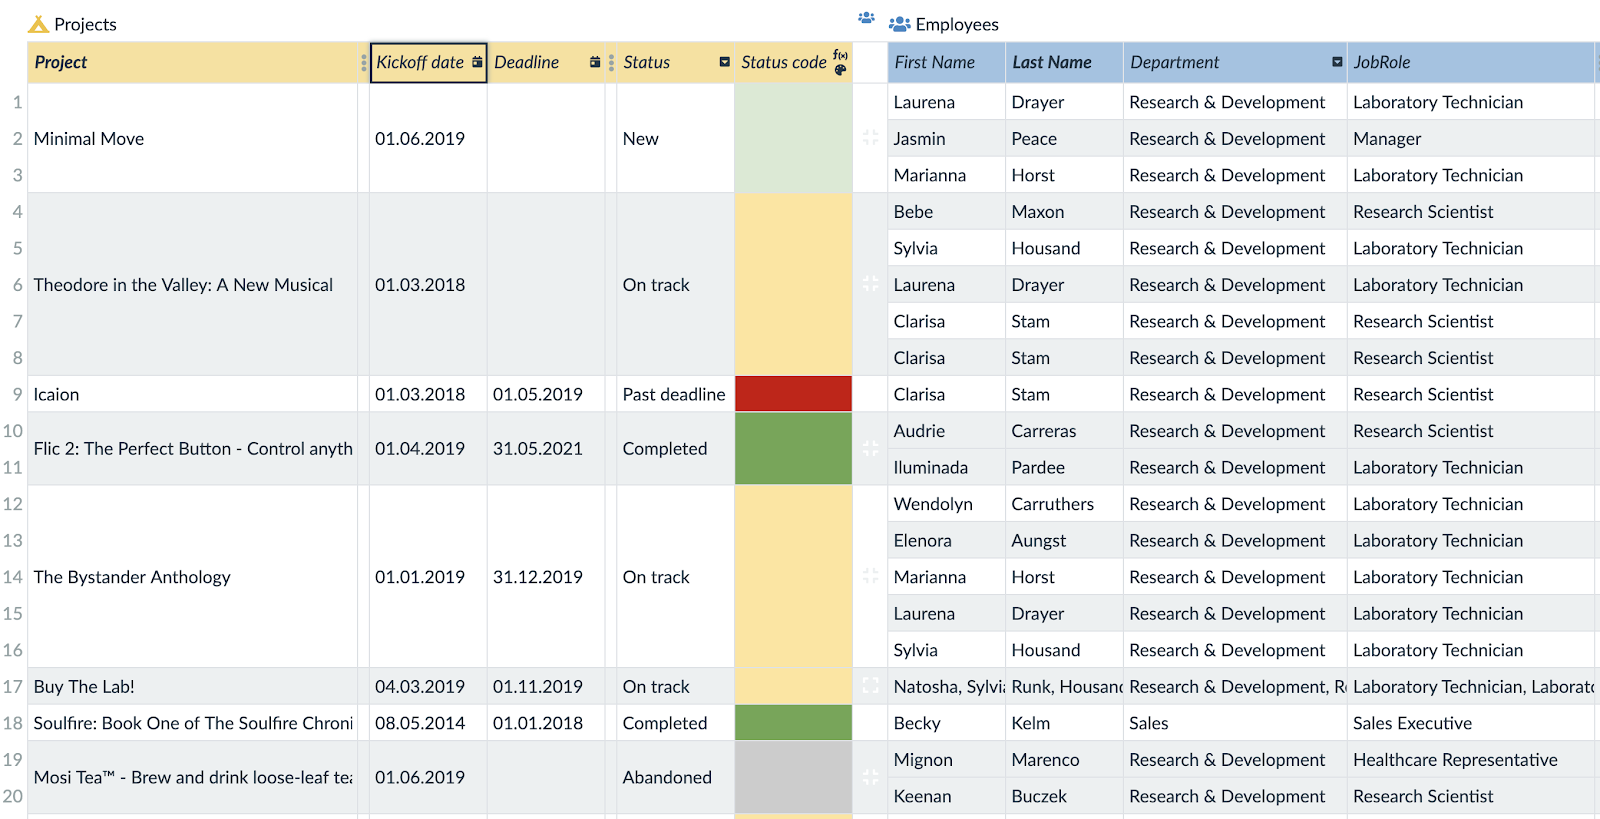
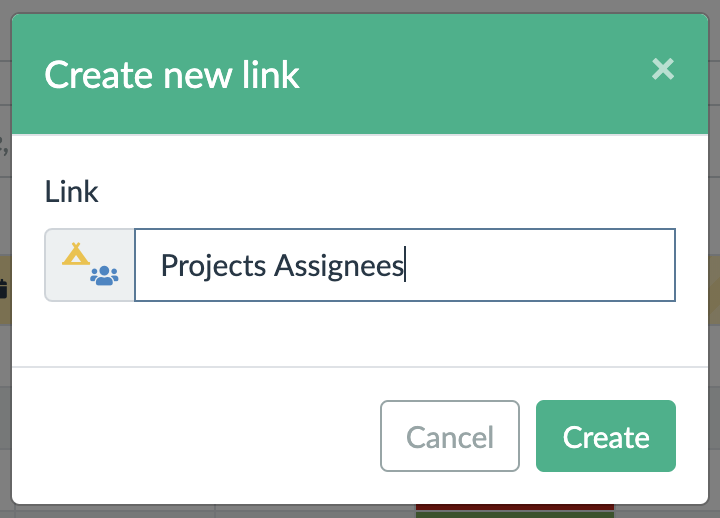
There can be multiple relations with various meanings. In our case it means who works on which project.
This is overly simplified as not everybody typically works on a project from the very beginning till the very end. Especially when a project has a longer time span.
To track more details, we can add additional attributes (or columns if you will) to the link. We can add the start and end date of an assignment and also the allocation percentage.
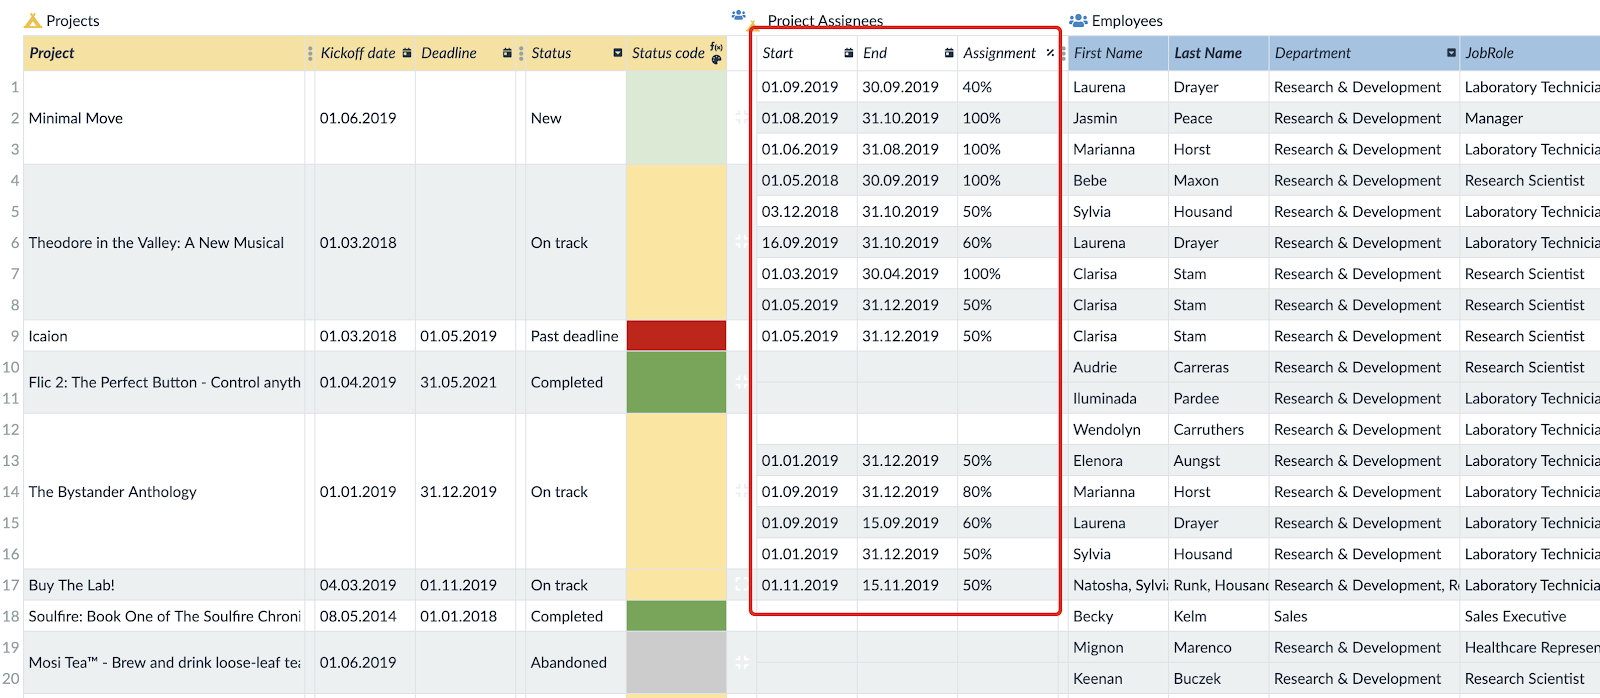
We can easily share only the relevant piece of the linked tables with all team members so that they can manage their part.
Now we can have a look at how to get a quick overview of our team utilisation. We can see that in Timelines.
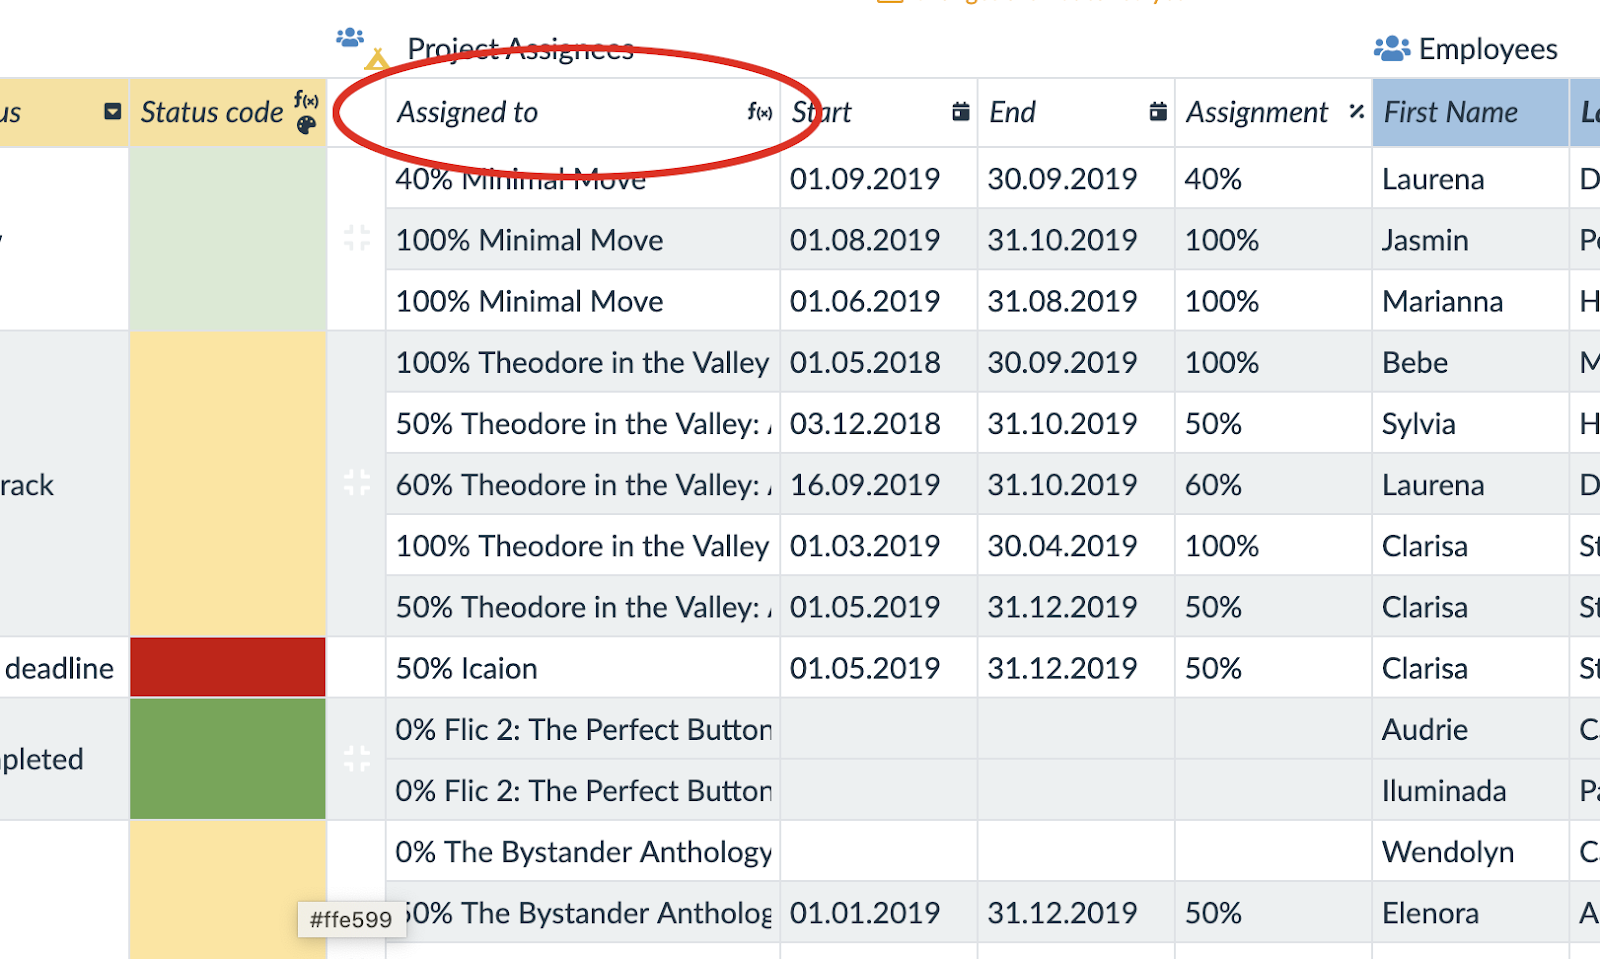
We need a bit of a preparation. Every table row can be linked to an arbitrary amount of other rows. This needs to aggregate linked table rows which Timelines do not support yet. Lumeer will automate that soon, but for now, we create a helper column in the link that collects the progress percentage and project name.
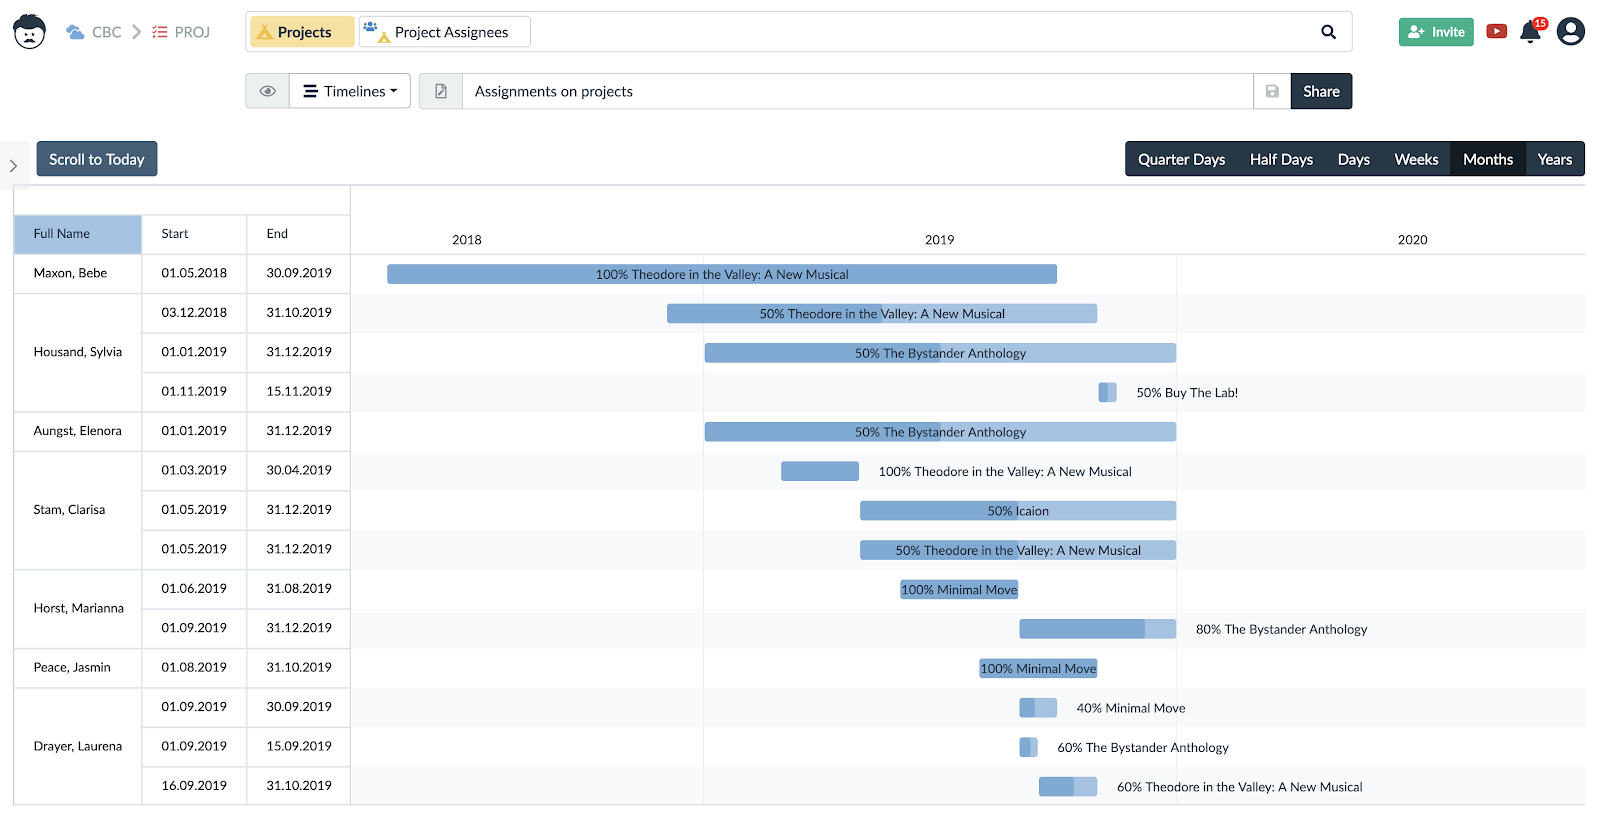
As we can see, it is now obvious, where we have enough resources available to commit ourselves to a new project.
On the left, we can see the list of our employees and on the right side, there are the time lines representing the assignment of individual employees to the projects. The percentage values denote the assignment proportions out of each team member’s time.
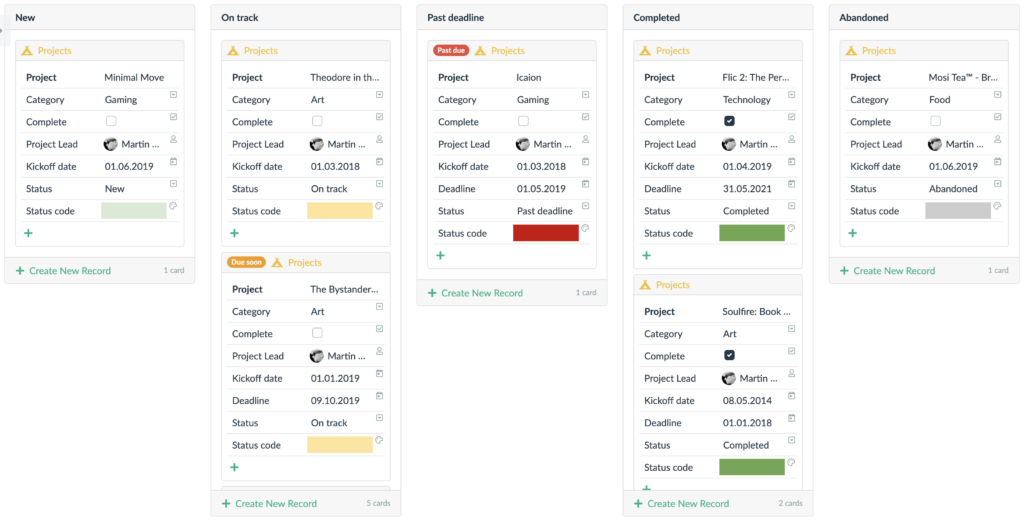
As a bonus, we can see the Projects on an agile Board grouped by their state. We can even easily see projects that are due soon or past due.
With Lumeer, you’ll make your organisation as efficient as possible!
