11 Visual Ways to Access Your Data

There are 11 visual ways to access your data. Your data are always stored in tables that are very similar to sheets in your favorite spreadsheet editor. Lumeer even offers you the same freedom and flexibility setting up individual table columns.
On top of the tables, there are various visual views. It is like observing your data from different perspectives or using different glasses.
Let’s see what are the basic visual ways to access your data.
Visual Views to Access Your Data
Search View
The Search View shows all the data stored in your project in Lumeer. This is the basic way to access your data when you login to the application.
In the Search View, you can search for any items like tables, records or views. It also shows a list of all your stored views.
In the Search View, you can create new tables and access table configuration.
You can also mark some views as favourite and store them in bookmarks.
The Search View works as a home screen and you can always get to it by clicking on the Lumeer icon in the top left corner.
For more information see Using the Search View.
Table View
The Table View is the most common way to access your data. It is used when you click on any table in the Search View.
The Table View can display your data (records) in a tabular form like you are used to from Microsoft Excel or Google Sheets.
It is an ideal place to get your data into shape after importing them from a CSV file.
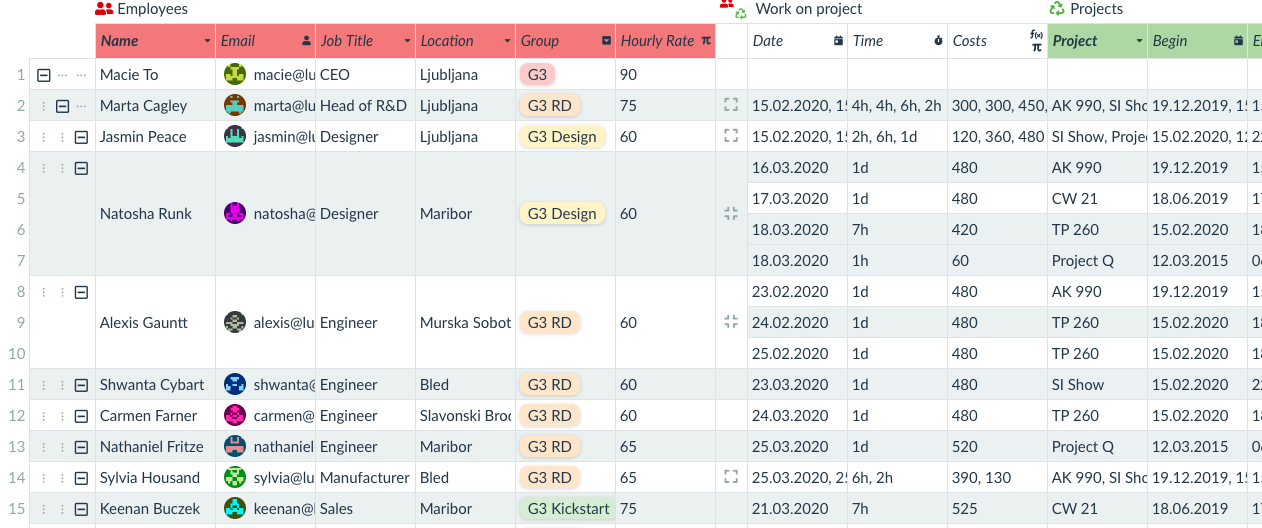
In addition to basic spreadsheets, Lumeer can link tables together or set column types. To make sure your data have the format as expected.
The number of tables linked together is not limited. However, for a meaningful usage, we recommend using maximum of three or four linked tables in the Table View.
A table support hierarchies and advanced filtering using the query bar at the top. Columns can be dragged around, or completely hidden.
There is a possibility to add columns between two linked tables. This means that the values are stored within the connection between two lines.
A typical example for that is a table with orders and a table items in the warehouse. For every order, we need to specify the number of particular items. This goes on the link between the two tables.
Moreover, Lumeer understands the meaning of data in individual columns. That way, the application offers you the right tools to work with data in a meaningful manner. For example to group date values by month and year.
For en example of how to use tables, have a look at the Work Tracker project template.
If you want to learn more details about using Tables see Using the Table View.
Workflow View
In the Workflow view, you can filter, sort, or group your work items. It is also possible to quickly switch between the details of the items, see linked records and manipulate with links, comment on the work items, and see their audit log (history of changes).
Moreover, you have a full control of what attributes (columns) are displayed where.
The Workflow view also allows you to display several different tables on a single screen.
The core value of using the Workflow view is in the detail panel. In this detail panel, you can find everything about the selected record. For your convenience, you can resize the detail panel as needed.
One of the recent additions to the Workflow view is a full support of collapsible hierarchies. This is especially useful for subtasks.
For more information on all the details of the Workflow View see Using the Workflow View.
Detail View
The Detail View inspects items, as its name suggests, in their full detail. It is similar to a card file.
You can select individual cards from the list at the top. All values can be updated. Data types and functions can be configured there as well.
It is possible to walk through many items and update them in a row.
There are also linked items displayed at the bottom. It is possible to link other items, unlink existing, or follow the links and open linked items.
For more details on this visual way to access your data see Using the Detail View.
Board (Kanban) View
The Board View shows items on a board organized in columns. The columns are labeled according to values of any of the document attributes.
Most typically, the columns are created for each task state, or for assignees. Or even for sprints among which we reorganize tasks.
Use cases for a (Kanban) Board can be:
- tasks or projects by states
- tasks by assignees
- tasks by sprints
- prospects or clients by stage
Simply anything that needs to be visually divided into groups and moves between the groups. The moves between the columns in a board view resemble transitions between process states. That way, a workflow can be implemented.
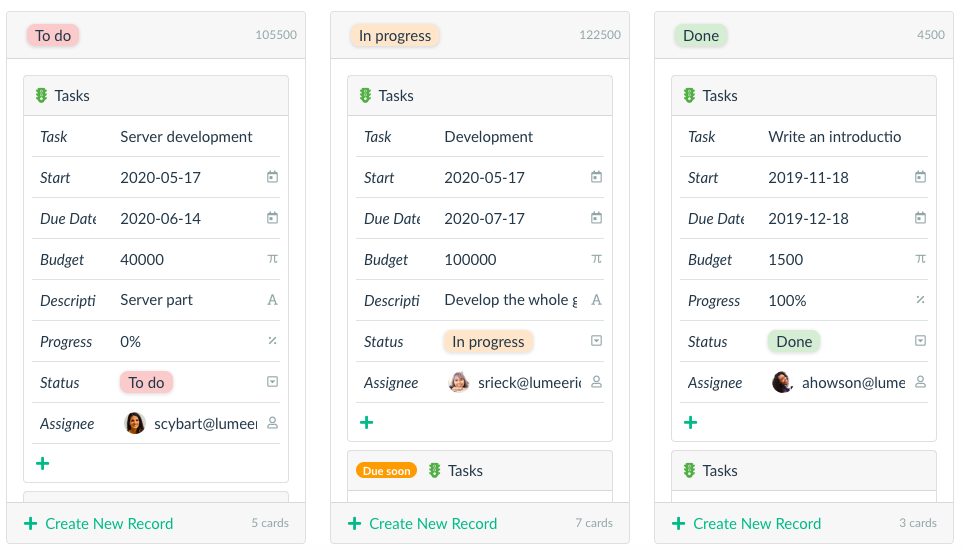
For each column, you can see how many cards there are (in its footer). Also select an attribute that you want to aggregate for each column (e.g. time spent, budget, story points…) in the column header.
You can select an attribute with the due date which then shows us Due soon and Past due warnings.
By setting which columns represent the done state you switch off Due soon and Past due warnings for those particular columns.
The columns can be reordered by a mouse drag. Individual items can be dragged between columns.
Values on the cards can be directly edited. Changing the value that determines the card column position will move it automatically.
Configure the attributes visible on the cards as well as their order.
An example of the Board View usage can be found in the article How to track progress of a project on the board.
To learn all the details about the Board View see Using the Board View.
Timelines View (Gantt Chart)
The Timelines view (or so called Gantt Chart) is an exceptionally powerful type of view because it allows us to see 7 various attributes of every single record/row/item.
Timelines View is typically used to display:
- tasks,
- projects,
- orders,
- resource utilization (e.g. hotel room bookings),
- planned events etc.
There are even ways to display more than 7 attributes as noted below. What we can see at once and how we can update the values in Lumeer?
Item description (e.g. task name) – can be updated in a detail dialog opened by a double-click.
Start date – can be updated by a mouse drag and drop.
End date – can be updated by a mouse drag and drop.
Progress – can be updated by a mouse drag and drop.
Color (e.g. task state) – can be changed automatically upon reaching 100% progress or in the detail dialog. Timelines view can work with selection, checkboxes, colors, and progress attributes.
Hierarchy or dependencies between items, displayed as links – can be updated by mouse dragging.

Categories or swimlanes – in theory there can be an unlimited number of categories and sub-categories can be changed by dragging items between categories. Btw. Timelines view can add any number of category attributes.
A new item can be added to the Timelines view by a single drag and drop in an empty space on the timeline.
For your convenience, you can also change the displayed granularity as days, weeks, months etc.
The Gantt chart is demonstrated in its entirety in the Remote Work template for example. Give it a try today!
Integrations allow synchronization with other planning applications.
For all the details and possibilities of the Timelines View see Using the Timelines View.
Calendar View
The Calendar View displays items in a calendar, and an agenda (list). These can be events, tasks, bookings, deadlines, order arrivals etc.
Multiple types of items from various tables can be mixed in a single calendar giving the big picture and detailed overview of the whole situation.
The items can span several days and can be moved by a simple mouse drag.
New items can be added by clicking anywhere in the calendar, existing items can be updated in their full detail by double clicking on them.
The calendar allows various levels of granularity (months, weeks, days, task list). When opening a Calendar view, it can automatically scroll to today or to the last saved position.
The agenda view (as shown above), can be very efficient when fulfilling orders, one by one in a timely manner. Or to simply view your whole day agenda.
A special feature allows using column groups in the Calendar view. This is useful when comparing calendar of various people, teams, resources etc.
For example, in our Wedding Planning Template, the calendar groups are used to display actions of individual wedding guest groups.
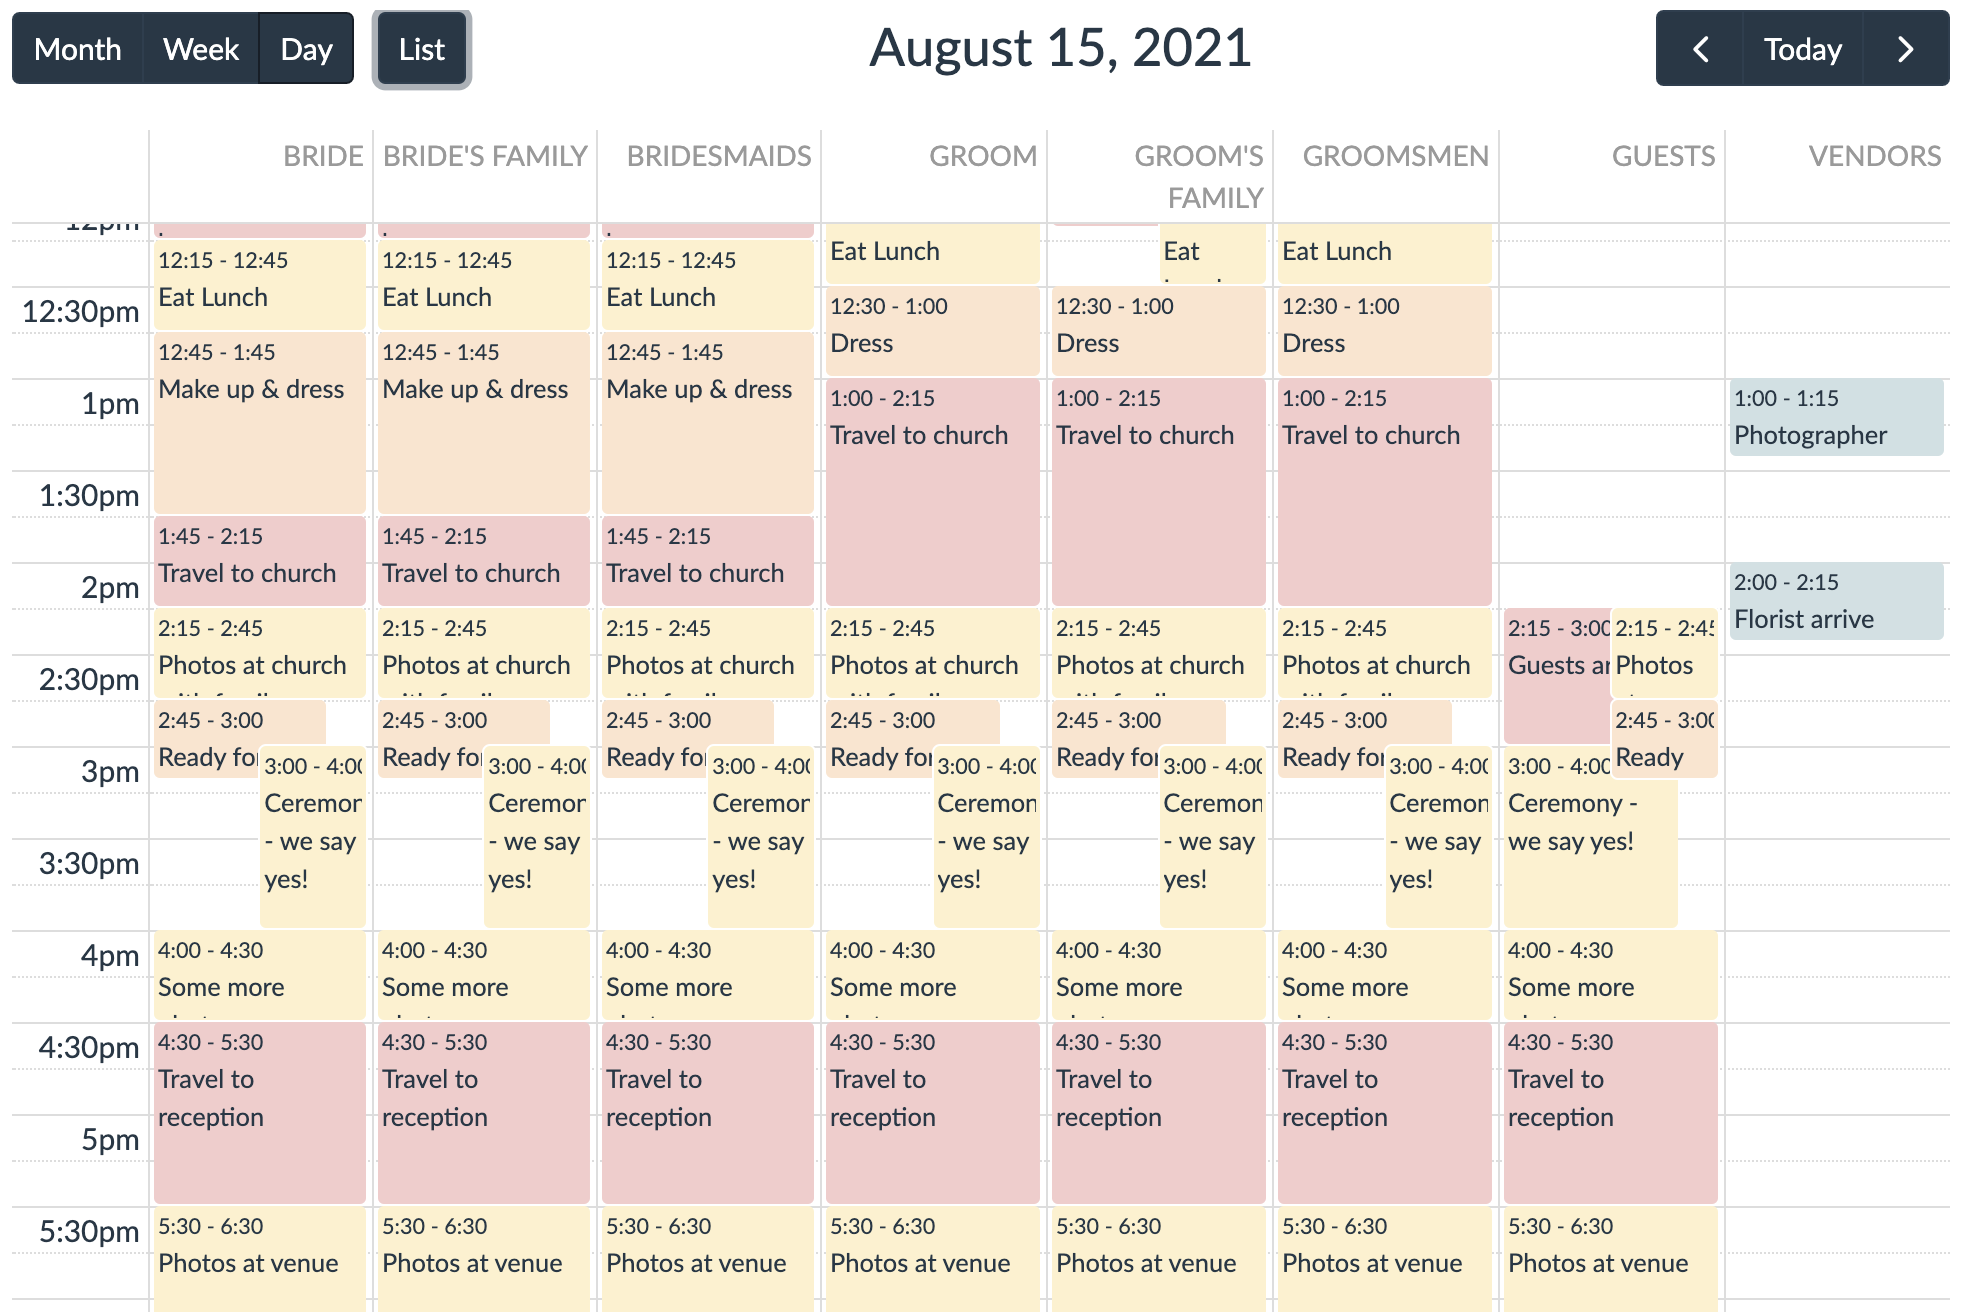
The same event can be present in multiple columns if it affects the same groups.
Integrations allow synchronization with other calendar applications.
For all the information on Calendar View see Using the Calendar View.
Chart View
The Chart View has the same advanced data aggregation abilities as the Pivot Table View (see below). It just displays the results in a chart. At the moment, this can be a line chart, a bar chart, a pie chart, and a bubble chart.
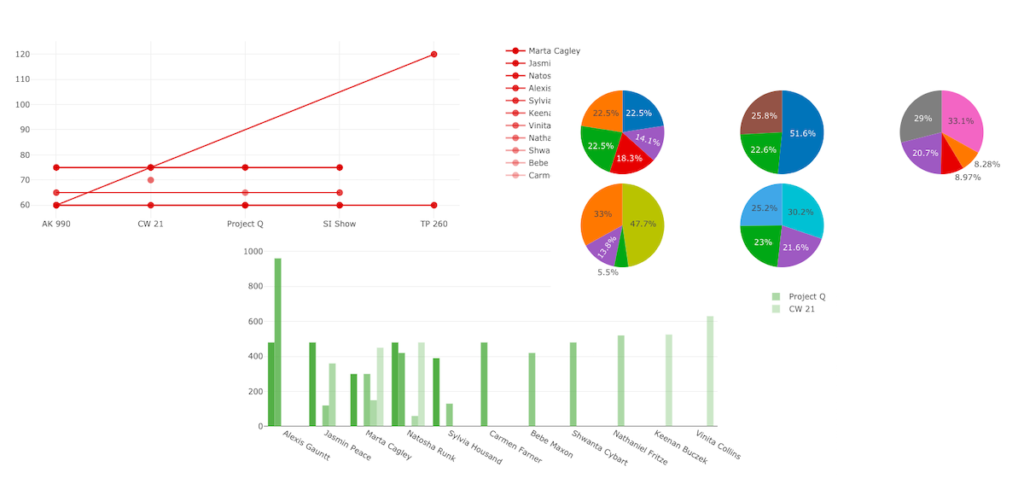
We are adding more chart types to the Chart View as per user requests.
There can be two independent Y axes in a line or bar chart and the chart is interactive. It can be zoomed or scrolled by mouse.
Even the data points can be directly moved by a drag of a mouse when they do not come from an aggregation of several values.
The chart can aggregate data across connected tables. It means that one table can contain the data sets and the other one can hold individual values for the data set. Multiple data sets can be displayed at once.
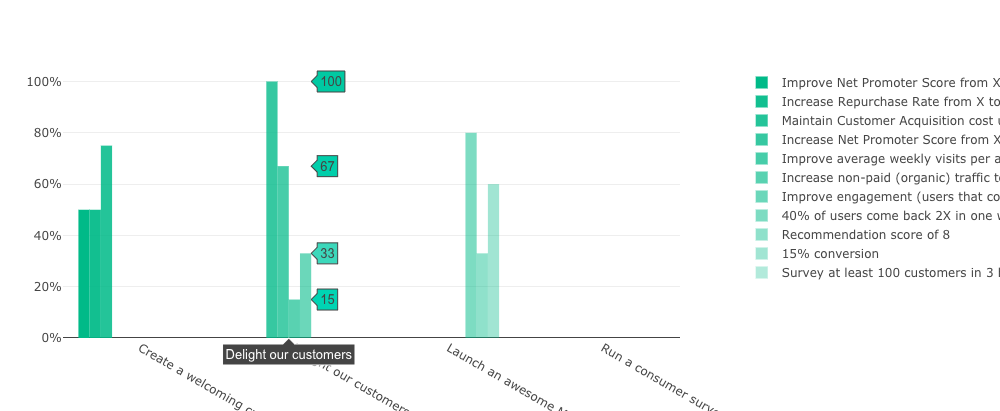
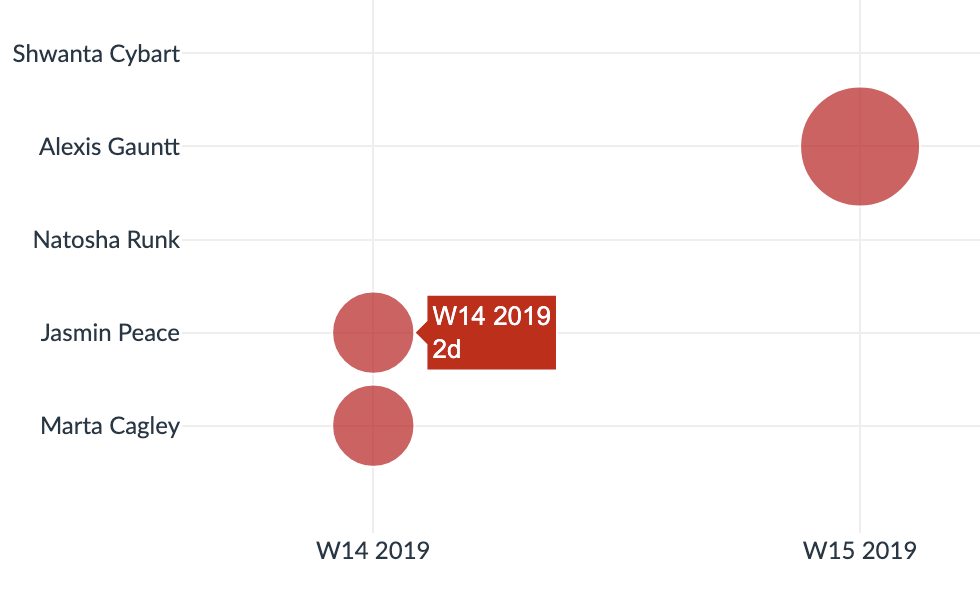
Another type of supported Chart View type is a bubble chart that can be used to display one more visual attribute. That is a size of the bubbles. This is useful for visually demonstrating employees efficiency as a punchcard.
The Chart View can of course work with most data types like number, percentage, duration, date and time, selection, email, color and checkbox.
For more detail on setting up the Chart View see Using the Chart View.
Pivot View
The Pivot Table View is the most advanced pivot table we are aware of. It can aggregate on multiple levels and sort items. Filtering is provided through Lumeer’s built-in query system.
Moreover, the Pivot Table View can handle attributes like dates in a natural way and offers you aggregations by months, days of week, hours of day and many more.
There are also some advanced configuration options for specific column types. In the case of duration, you can configure the maximal time unit used to aggregate the values (like hours, so that days and weeks are computed as hours).
Available aggregation options are: unique values, count, average, minimum, maximum, and sum.
Pivot Table view also respects the visual representation of individual data columns – e.g. tags for selection, user icons, checkboxes etc.
Columns and rows can be sorted. It is also possible to display relative values – percentage of column, row, or all the values in the pivot table.
We have created a lot of useful material about Pivot Tables and how to work with them:
- What is a Pivot Table and how to create it: complete guide for 2020
- Pivot Table Examples: An ultimate collection of 62 use cases
- Pivot Tables Cheatsheet
For all the details on configuring the Pivot Table View see How to create a pivot table on a few clicks.
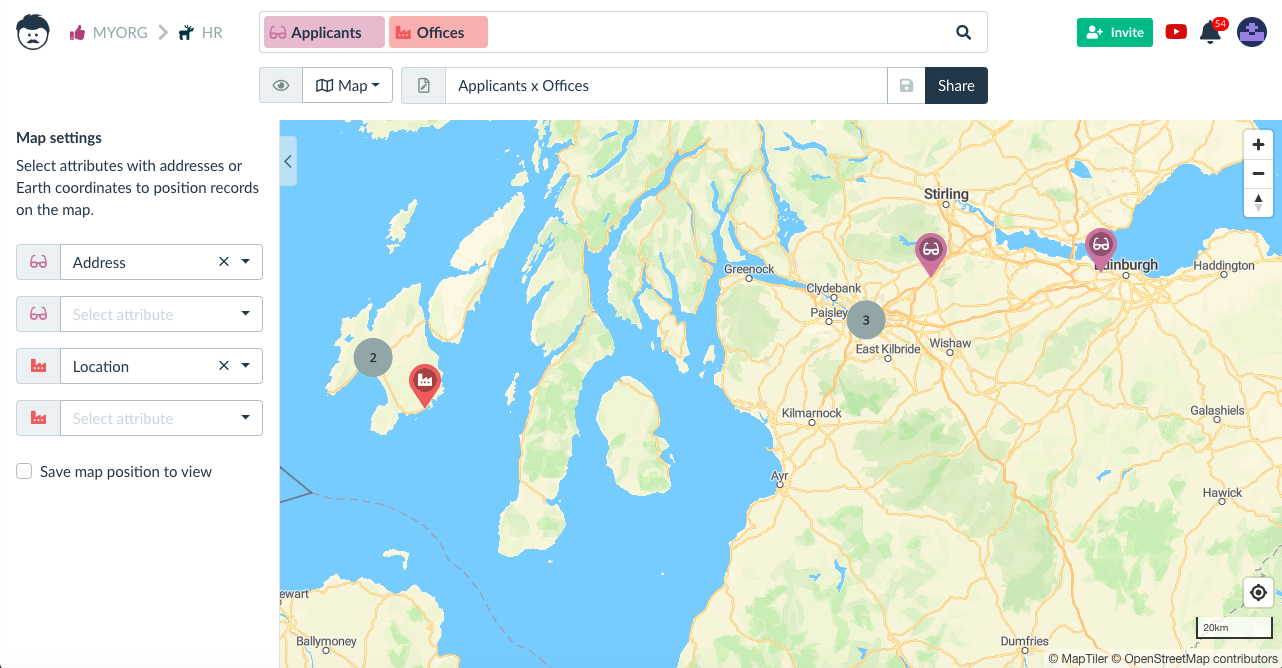
Map View
The Map View displays addresses and geographical coordinates on a map. Multiple tables or sources of location can be used at the same time and mixed on a single map.
This is especially useful for locating several resources, like vehicles, warehouses, delivery addresses, remote employees, office locations etc.
The detail of each item can be directly edited by a double click.

The items on a map can be moved by a drag of a mouse. In the case of address fields, a new nearest address is assigned automatically.
Worldwide address systems are supported.
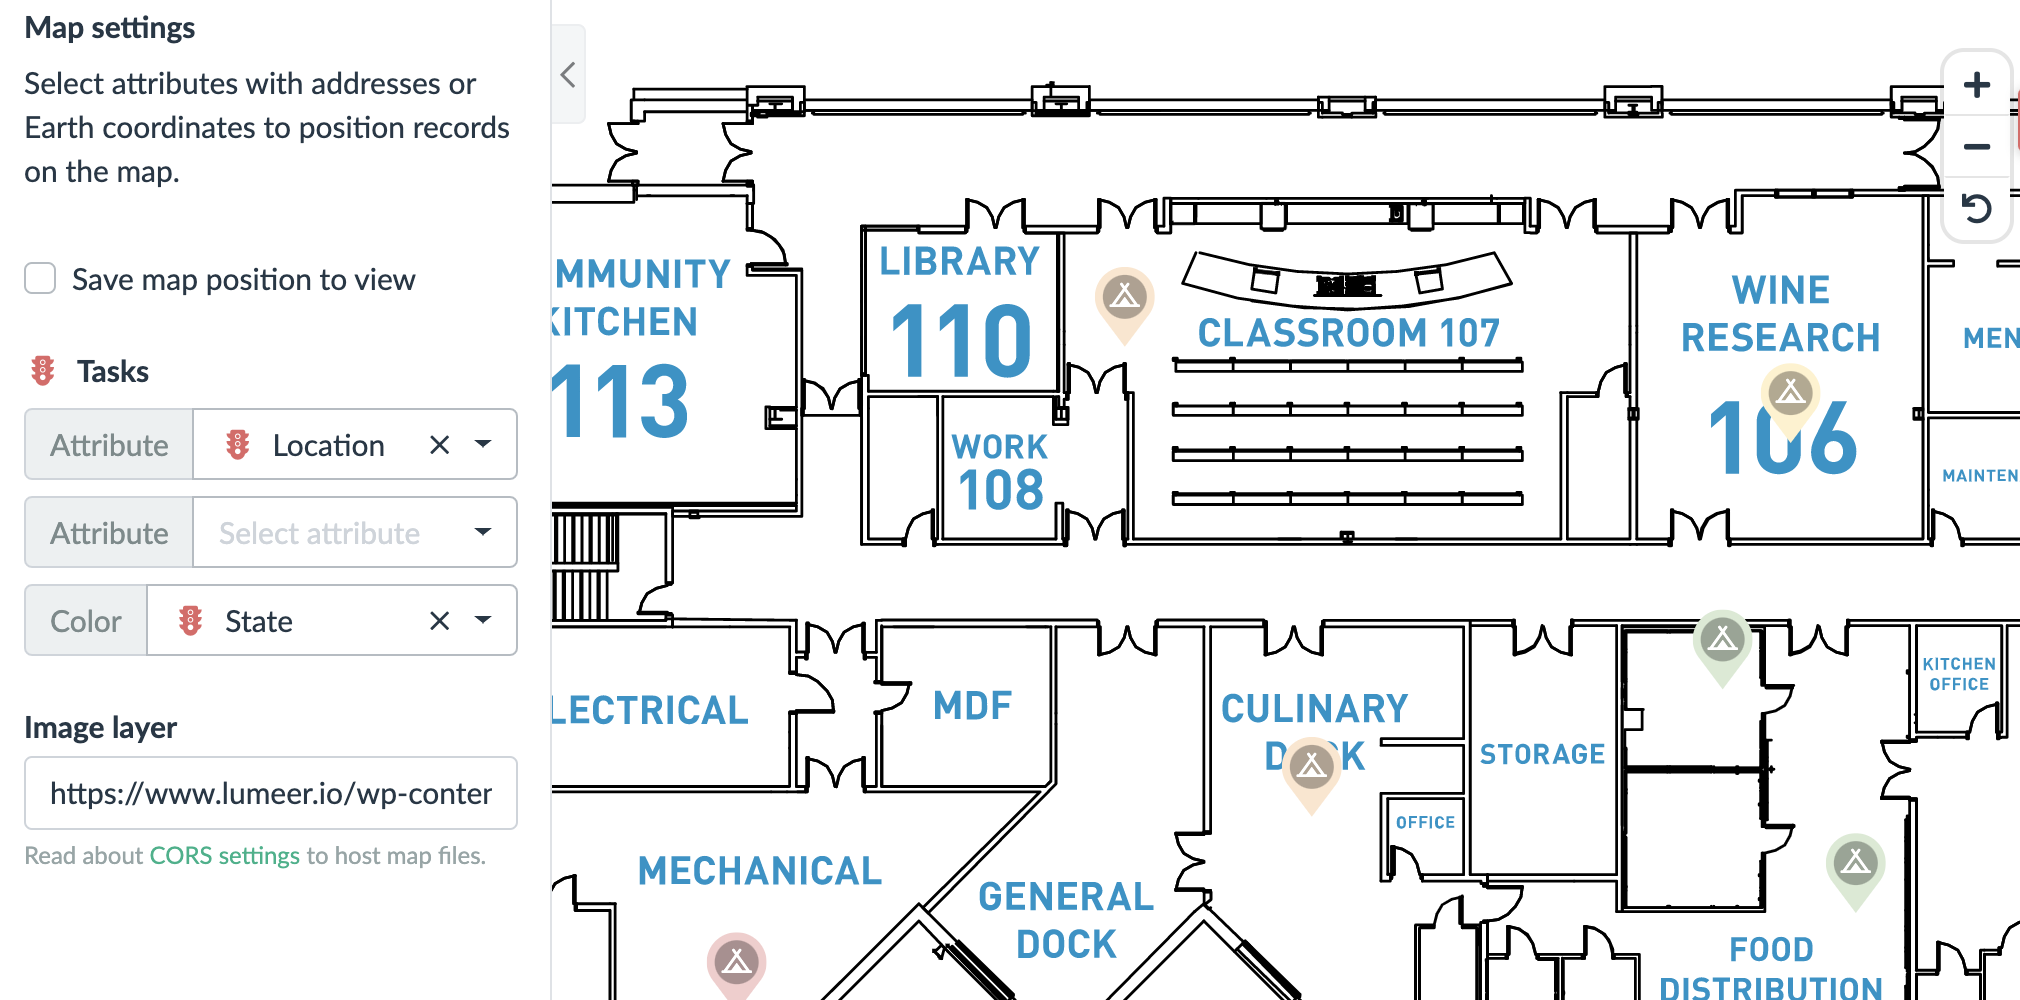
Custom Layer in Map View
For specific cases, like very detailed maps of specific locations or buildings, it is possible to use you own layer in the map view. The layer is specified in the form of an address (URL) to the file.
Such use cases typically include tasks bound to a given location. These can be maintenance tasks, conference venue tasks, construction work etc.
In the image below, you can notice maintenance tasks on a conference venue map. The pins are colored according to the task state.
We recommend using vector graphics (SVG) in map view for the best performance. However, JPG and PNG is also supported. The layer size limit is 20MB.
We also recommend checking the configuration of the CORS headers of the server hosting your map files.
For all the details on setting up the Map View see Using the Map View.
Form View
Using the Form View is best for submitting (adding) new records, and creating records with links in a single flow. You can use the Form View for editing existing records as well.
The typical use case is adding tasks linked to projects, or reporting work done on projects. But the possibilities are limitless.
Forms can be used to edit existing records.
As well as to add new records.
All the input fields and form buttons can be fully customized.
For more information on how to configure and use the Form View see Using the Form View.
Conclusion
As you can see, there are currently 11 different visual ways to access your data. We recommend you use a specific visual way for every use case or process task so that your team member are most efficient.
More visual views are constantly being added. Try them on your own now!